Most deployment guides for SRX clusters out there focus on standard two-port deployments, where you have one port in, one port out and a couple of cluster links that interconnect and control the cluster. Unfortunately, in that design, one simple link failure will usually make the cluster fail over. Coming from the R&S realm, I am very careful when it comes to physical redundancy so I wanted to figure out a way to get this working with Etherchannels.
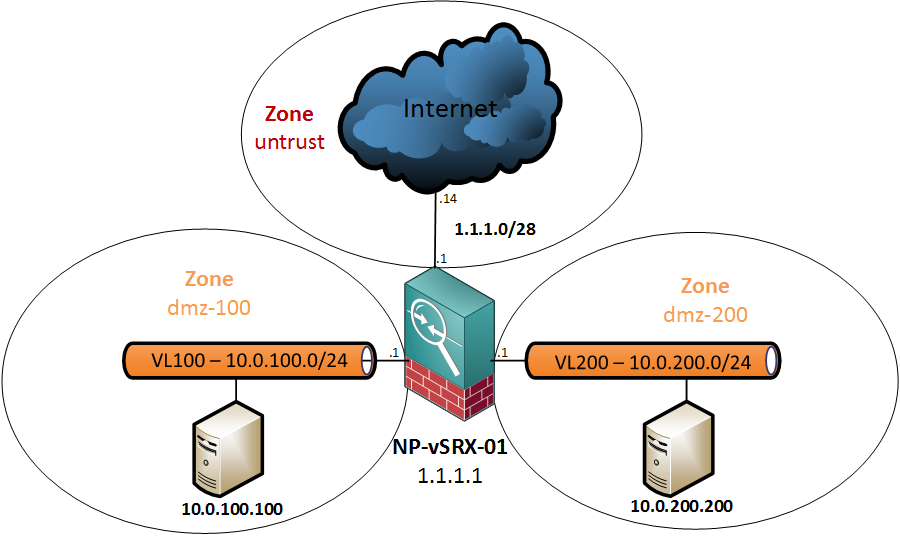
After a lot of reading and some trial and error, I ended up with a working solution. Probably not perfect, but definitely more redundant. So, in this post we will get the topology below configured and afterwards do some failover testing.
Basic Cluster Setup
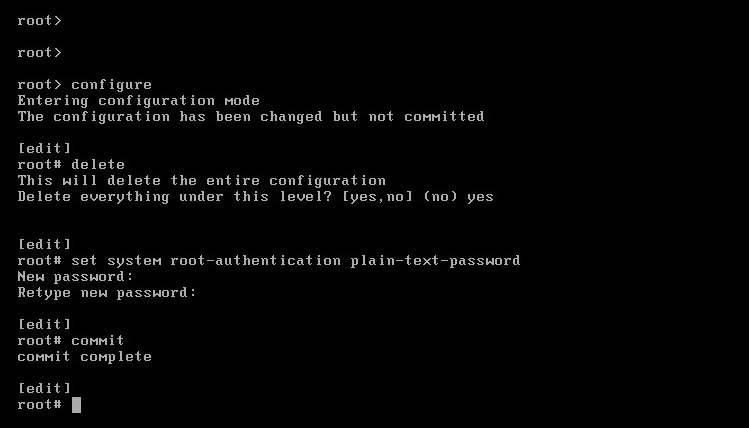
The commands below will get the basic cluster up and running, assuming you have already configured the cluster and node ids.
set system root-authentication encrypted-password "$1$FQl4d.NC$l25c0bDGr5aPq9ZHx0R.S."
set groups node0 system host-name FW01A
set groups node1 system host-name FW01B
set apply-groups "${node}"
set chassis cluster reth-count 2
set chassis cluster redundancy-group 0 node 0 priority 120
set chassis cluster redundancy-group 0 node 1 priority 1
set chassis cluster redundancy-group 1 node 0 priority 120
set chassis cluster redundancy-group 1 node 1 priority 1
set chassis cluster redundancy-group 1 preempt
set interfaces fab0 fabric-options member-interfaces fe-0/0/5
set interfaces fab1 fabric-options member-interfaces fe-1/0/5
Layer3 Etherchannel configuration on the SRX
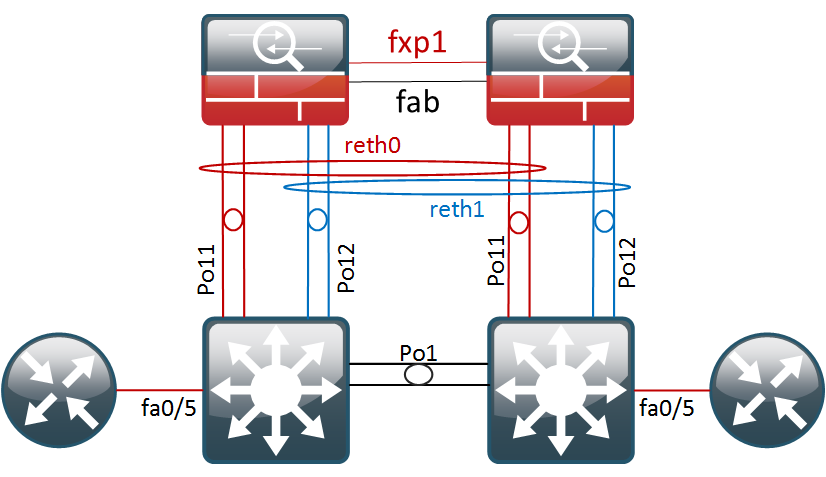
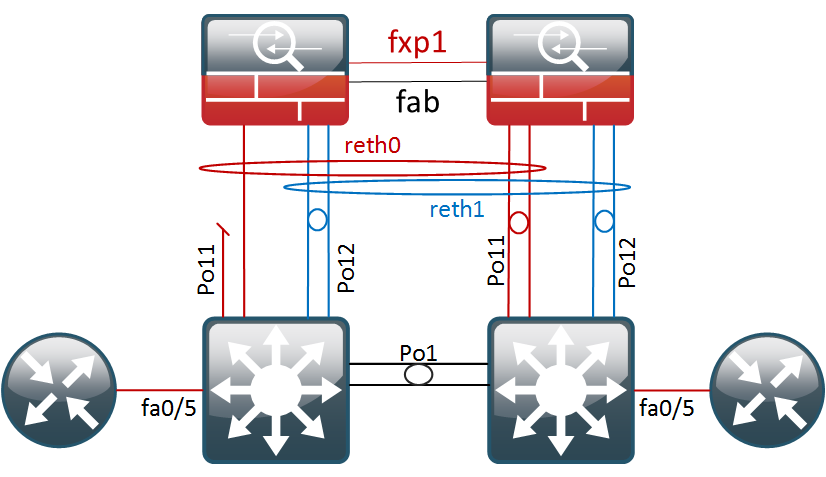
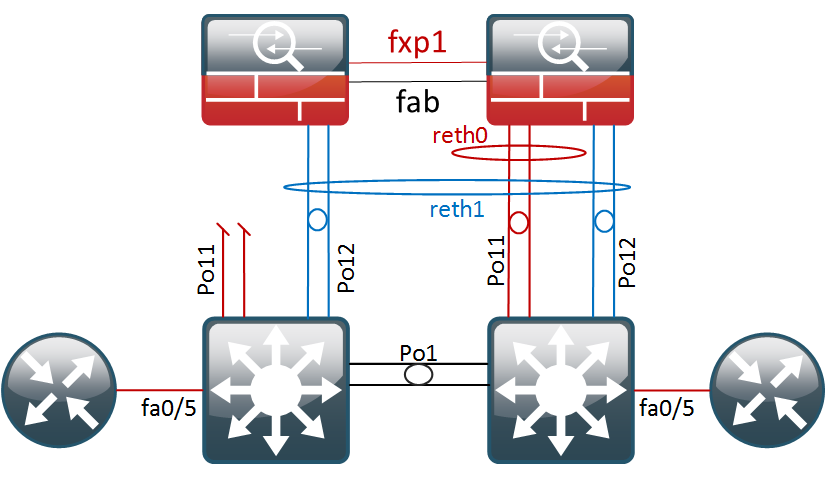
The physical ports will be bundled in two reth interface. Per reth interface, we will add two physical ports per cluster node, which yields a total of four ports. However only two links will ever be actively forwarding traffic – those on the active RG.
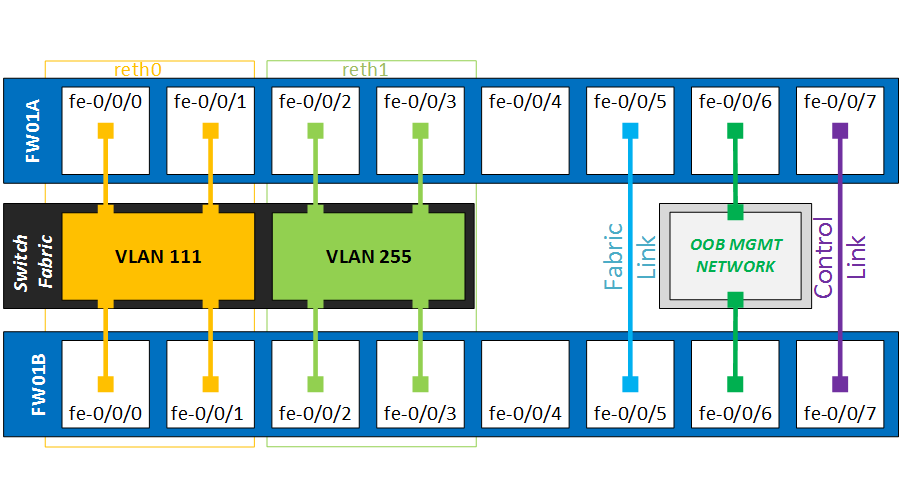
It is important that the links from every cluster nodes are terminated on separate etherchannels on the switches. Otherwise the switches would also load-balance the traffic over the two non-forwarding ports, as documented here…
In my topology, both switches have a Port-Channel 11 and 12, going to their own cluster node.
{primary:node0}
root@FW01A> show configuration interfaces
fe-0/0/0 {
    fastether-options {
        redundant-parent reth0;
    }
}
fe-0/0/1 {
    fastether-options {
        redundant-parent reth0;
    }
}
fe-0/0/2 {
    fastether-options {
        redundant-parent reth1;
    }
}
fe-0/0/3 {
    fastether-options {
        redundant-parent reth1;
    }
}
fe-1/0/0 {
    fastether-options {
        redundant-parent reth0;
    }
}
fe-1/0/1 {
    fastether-options {
        redundant-parent reth0;
    }
}
fe-1/0/2 {
    fastether-options {
        redundant-parent reth1;
    }
}
fe-1/0/3 {
    fastether-options {
        redundant-parent reth1;
    }
}
Pay special attention to the configuration of the reth interfaces. First, we tie the redundant interfaces to our redundancy-group 1, in which we will later control the failover conditions.
The minimum-links command determines how many interfaces must be up before the LACP bundle is considered up. Although we have two interfaces per cluster, we still want traffic forwarded in a worst-case scenario. Setting minimum-links 1 will keep the Etherchannel up even in the unlikely event of having three physical ports down.
reth0 {
    vlan-tagging;
    redundant-ether-options {
        redundancy-group 1;
        minimum-links 1;
        lacp {
            active;
            periodic fast;
        }
    }
    unit 111 {
        vlan-id 111;
        family inet {
            address 1.1.1.1/28;
        }
    }
}
reth1 {
    vlan-tagging;
    redundant-ether-options {
        redundancy-group 1;
        minimum-links 1;
        lacp {
            active;
            periodic fast;
        }
    }
    unit 255 {
        vlan-id 255;
        family inet {
            address 10.255.255.254/28;
        }
    }
}
By adding the vlan-tagging command, and adding a logical subinterface (unit 255) with vlan-id 255 specified, we are creating a tagged L3 Etherchannel. In other words, the SRX is expecting packets for sub-interface reth1.255 to be tagged with a dot1q value of 255. The unit number can be any number you like, but it’s best to keep the unit number and the dot1q value aligned – for your own sanity! 🙂
Security Zones and Policies
To check basic connectivity and later run some failover tests, I have added the following configuration for the Security Zones, Policies and Source NAT. In a production environment, you probably won’t be allowing ping.
root@FW01A# show zones
security-zone trust {
    address-book {
        address Net-10.255.255.240-28 10.255.255.240/28;
    }
    host-inbound-traffic {
        system-services {
            ping;
        }
    }
    interfaces {
        reth1.255;
    }
}
security-zone untrust {
    address-book {
        address Net-1.1.1.0-28 1.1.1.0/28;
    }
    interfaces {
        reth0.111 {
            host-inbound-traffic {
                system-services {
                    ping;
                }
            }
        }
    }
}
{primary:node0}[edit security]
root@FW01A# show policies
from-zone trust to-zone untrust {
    policy Test-Policy {
        match {
            source-address Net-10.255.255.240-28;
            destination-address Net-1.1.1.0-28;
            application any;
        }
        then {
            permit;
        }
    }
}
{primary:node0}[edit security]
root@FW01A# show nat
source {
    rule-set SNAT-Trust-to-Untrust {
        from zone trust;
        to zone untrust;
        rule HideNAT-1 {
            match {
                source-address 10.255.255.240/28;
            }
            then {
                source-nat {
                    interface;
                }
            }
        }
    }
}
Preparing the switches for L2
I’m running two Cisco 3550 switches as my layer3 core switches. For now, I will just add the Layer 1 and 2 stuff.
vlan 111
 name untrust
!
vlan 255
 name transit


interface range fastEthernet 0/1 - 2
 channel-group 11 mode active

interface range fastEthernet 0/3 - 4
 channel-group 12 mode active

int po 11
 switchport trunk encapsulation dot1q
 switchport mode trunk
 switchport nonegotiate
 switchport trunk allowed vlan 111

int po 12
 switchport mode trunk
 switchport nonegotiate
 switchport trunk allowed vlan 255
For CS2, we can copy paste the exact same config.
A second trunk link is added between the core switches, which will carry inter-switch traffic for VLAN 111 and 255.
interface FastEthernet0/23
 channel-group 1 mode active
!
interface FastEthernet0/24
 channel-group 1 mode active

...

interface Port-channel1
 switchport trunk encapsulation dot1q
 switchport trunk allowed vlan 111,255
 switchport mode trunk
 switchport nonegotiate
The LACP configuration is now complete, and after cabling everything up we see the Port-channels are in the bundled state:
NP-CS1>show etherchannel summary
Flags:  D - down        P - bundled in port-channel
        I - stand-alone s - suspended
        H - Hot-standby (LACP only)
        R - Layer3      S - Layer2
        U - in use      f - failed to allocate aggregator

        M - not in use, minimum links not met
        u - unsuitable for bundling
        w - waiting to be aggregated
        d - default port


Number of channel-groups in use: 3
Number of aggregators:           3

Group  Port-channel  Protocol    Ports
------+-------------+-----------+-----------------------------------------------
1      Po1(SU)         LACP      Fa0/23(P)   Fa0/24(P)
11     Po11(SU)        LACP      Fa0/1(P)    Fa0/2(P)
12     Po12(SU)        LACP      Fa0/3(P)    Fa0/4(P)
The SRX is bit more detailed with the information in the lacp command
root@FW01A> show lacp interfaces
Aggregated interface: reth0
    LACP state:       Role   Exp   Def  Dist  Col  Syn  Aggr  Timeout  Activity
      fe-0/0/0       Actor    No    No   Yes  Yes  Yes   Yes     Fast    Active
      fe-0/0/0     Partner    No    No   Yes  Yes  Yes   Yes     Slow    Active
      fe-0/0/1       Actor    No    No   Yes  Yes  Yes   Yes     Fast    Active
      fe-0/0/1     Partner    No    No   Yes  Yes  Yes   Yes     Slow    Active
      fe-1/0/0       Actor    No    No   Yes  Yes  Yes   Yes     Fast    Active
      fe-1/0/0     Partner    No    No   Yes  Yes  Yes   Yes     Slow    Active
      fe-1/0/1       Actor    No    No   Yes  Yes  Yes   Yes     Fast    Active
      fe-1/0/1     Partner    No    No   Yes  Yes  Yes   Yes     Slow    Active
    LACP protocol:        Receive State  Transmit State          Mux State
      fe-0/0/0                  Current   Slow periodic Collecting distributing
      fe-0/0/1                  Current   Slow periodic Collecting distributing
      fe-1/0/0                  Current   Slow periodic Collecting distributing
      fe-1/0/1                  Current   Slow periodic Collecting distributing
Layer3 Switch Configuration
Now that we have our layer 2 connectivity, we can move on to the IP addressing. On the L3 switches, I will configure the SVIs in the transit network, and run HSRP between them with hello/hold timers of 1 and 3 seconds. This would allow for a reasonable failover time in case of an outage.
NP-CS1:
interface Vlan255
 ip address 10.255.255.242 255.255.255.240
 standby 255 ip 10.255.255.241
 standby 255 timers 1 3
 standby 255 priority 110
 standby 255 preempt
NP-CS2:
NP-CS2#sh run int vlan 255
!
interface Vlan255
 ip address 10.255.255.243 255.255.255.240
 standby 255 ip 10.255.255.241
 standby 255 timers 1 3
 standby 255 preempt
The VLAN interfaces come up immediately and as a final test for basic L3 connectivity, we try pinging the SRX from the core switch.
NP-CS1#ping 10.255.255.254 repeat 10

Type escape sequence to abort.
Sending 10, 100-byte ICMP Echos to 10.255.255.254, timeout is 2 seconds:
!!!!!!!!!!
Success rate is 100 percent (10/10), round-trip min/avg/max = 1/2/4 ms
Checking the ARP table, we can see the Cluster MAC address, with the 4th last digit (1) being the cluster ID and the last two (01) the reth number.
NP-CS1#show ip arp
Protocol  Address          Age (min)  Hardware Addr   Type   Interface
Internet  10.255.255.254          1   0010.dbff.1001  ARPA   Vlan255
Internet  10.255.255.242          -   0012.7f81.8f00  ARPA   Vlan255
Internet  10.255.255.243          8   000d.ed6f.9680  ARPA   Vlan255
Internet  10.255.255.241          -   0000.0c07.acff  ARPA   Vlan255
The default route on both core switches is pointed to 10.255.255.254
ip route 0.0.0.0 0.0.0.0 10.255.255.254
Internet segment configuration
I have connected two routers to the fa0/5 interfaces of the switches and added them to vlan 111. They are running HSRP with a VIP of 1.1.1.14 and hello/hold timers of 1 and 3 seconds.
ISP1#show standby brief
                     P indicates configured to preempt.
                     |
Interface   Grp  Pri P State   Active          Standby         Virtual IP
Fa0/1       111  110   Active  local           1.1.1.13        1.1.1.14
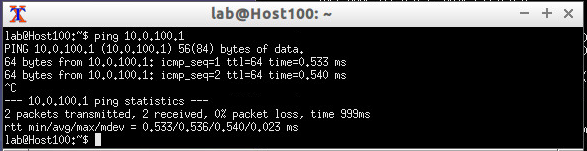
Running a simple ping to test connectivity between the firewalls and the ISP router.
root@FW01A> ping 1.1.1.14 count 1
PING 1.1.1.14 (1.1.1.14): 56 data bytes
64 bytes from 1.1.1.14: icmp_seq=0 ttl=255 time=2.981 ms

*snip*
To test if traffic is being forwarded across the firewall, we finally try reaching the ISP routers from the core switches.
NP-CS1#ping 1.1.1.14 source vlan 255

Type escape sequence to abort.
Sending 5, 100-byte ICMP Echos to 1.1.1.14, timeout is 2 seconds:
Packet sent with a source address of 10.255.255.242
!!!!!
Success rate is 100 percent (5/5), round-trip min/avg/max = 1/2/4 ms
After many bits of configuration, our cluster is live so we can start implementing some failover mechanisms.
Configuring the interface-monitor
When the interface-monitor is configured, it sets a threshold value of 255 to each redundancy group. Each interface is assigned a custom weight for the redundancy group, which is detracted from the threshold if the interface goes physically down. When the threshold reaches zero, the redundancy group and all its objects fail over.
Note – a commmon mistake (trust me) is to mix up the interface monitor weights with the RG priorities. These are two separate values, the interface monitor threshold is always 255 by default.
In my lab scenario, I will give each port a value of 128. Two physical links down will trigger a failover to node 1. This is the final configuration for redundancy group 1:
{primary:node0}[edit chassis cluster]
root@FW01A# show
reth-count 2;
redundancy-group 0 {
    node 0 priority 120;
    node 1 priority 1;
}
redundancy-group 1 {
    node 0 priority 120;
    node 1 priority 1;
    preempt;
    interface-monitor {
        fe-0/0/0 weight 128;
        fe-0/0/1 weight 128;
        fe-1/0/0 weight 128;
        fe-1/0/1 weight 128;
        fe-0/0/2 weight 128;
        fe-0/0/3 weight 128;
        fe-1/0/3 weight 128;
        fe-1/0/2 weight 128;
    }
Failover scenarios
- First, we will physically disconnect fe-0/0/0 which should not impact our regular traffic flow.
{primary:node0}
root@FW01A> show interfaces terse | match fe-0/0/0
fe-0/0/0                up    down
fe-0/0/0.111            up    down aenet    --> reth0.111
fe-0/0/0.32767          up    down aenet    --> reth0.32767
The JSRPD daemon logged the following entries in which we can see it decrement the value of 128 of the global threshold of 255.
root@FW01A> show log jsrpd | last | match 19:30
Oct  6 19:30:31 Interface fe-0/0/0 is going down
Oct  6 19:30:31 fe-0/0/0 interface monitored by RG-1 changed state from Up to Down
Oct  6 19:30:31 intf failed, computed-weight -128
Oct  6 19:30:31 LED changed from Green to Amber, reason is Monitored objects are down
Oct  6 19:30:31 Current threshold for rg-1 is 127. Failures: interface-monitoring
Oct  6 19:30:42 printing fpc_num h0
Oct  6 19:30:42 jsrpd_ifd_msg_handler: Interface reth0 is up
Oct  6 19:30:42 reth0 from  jsrpd_ssam_reth_read reth_rg_id=1
The chassis cluster interfaces also shows us the interface as down and how much weight it had:
root@FW01A> show chassis cluster interfaces | find Monitoring
Interface Monitoring:
    Interface         Weight    Status    Redundancy-group
    fe-1/0/2          128       Up        1
    fe-1/0/3          128       Up        1
    fe-0/0/3          128       Up        1
    fe-0/0/2          128       Up        1
    fe-1/0/1          128       Up        1
    fe-1/0/0          128       Up        1
    fe-0/0/1          128       Up        1
    fe-0/0/0          128       Down      1
Because our threshold value is still at 127 (255 – 128), RG1 is still active on node0 and no failover event was triggered.
Redundancy group: 1 , Failover count: 0
    node0                   120         primary        yes      no
    node1                   1           secondary      yes      no
- As a second test, we will also unplug fe-0/0/1. Without the interface monitoring, this would halt the forwarding of traffic to the untrust zone as
reth0would have no more interfaces on node0.
To get a basic idea of the failover time, I’m running a ping test from the core switch.
Sending 1000, 100-byte ICMP Echos to 1.1.1.14, timeout is 2 seconds:
!!!!!!!!!!!!!!!!!!!!!!!!!!!!!!!!!!!!!!!!!!!!!!!!!!!!!!!!!!!!!!!!!!!!!!
!.!!!!!!!!!!!!!!!!!!!!!!!!!!!!!!!!!!!!!!!!!!!!!!!!!!!!!!!!!!!!!!!!!!!!
!!!!!!!!!!!!!!!!!!!!!!!!!!!!!!!!!!!!!!!!!!!!!!!!!!!!!!!!!!!!!!!!!!!!!!
*snip*
We lost one packet during the failover with a timeout of two seconds, which is not bad at all. The switchover is stateful so TCP connections should be able to handle this just fine. Let’s see what happened on the SRX…
Our interface monitor shows two interfaces down that had a weight of 128. The threshold should now have reached zero which retired node0 from the cluster.
root@FW01A> show chassis cluster interfaces | find Monitoring
Interface Monitoring:
    Interface         Weight    Status    Redundancy-group
    fe-1/0/2          128       Up        1
    fe-1/0/3          128       Up        1
    fe-0/0/3          128       Up        1
    fe-0/0/2          128       Up        1
    fe-1/0/1          128       Up        1
    fe-1/0/0          128       Up        1
    fe-0/0/1          128       Down      1
    fe-0/0/0          128       Down      1
Redundancy group 1 is now primary on node1. The routing engine is still active on node0.
root@FW01A> show chassis cluster status
Cluster ID: 1
Node                  Priority          Status    Preempt  Manual failover

Redundancy group: 0 , Failover count: 0
    node0                   120         primary        no       no
    node1                   1           secondary      no       no

Redundancy group: 1 , Failover count: 1
    node0                   0           secondary      yes      no
    node1                   1           primary        yes      no
And the JSRPD logged documented the entire event:
Oct  6 19:43:01 Interface fe-0/0/1 is going down
Oct  6 19:43:01 fe-0/0/1 interface monitored by RG-1 changed state from Up to Down
Oct  6 19:43:01 intf failed, computed-weight -256
Oct  6 19:43:01 RG(1) priority changed on node0 120->0 Priority is set to 0, Monitoring objects are down
Oct  6 19:43:01 Successfully sent an snmp-trap due to priority change from 120 to 0 on RG-1 on cluster 1 node 0. Reason: Priority is set to 0, Monitoring objects are down
Oct  6 19:43:01 Current threshold for rg-1 is -1. Setting priority to 0. Failures: interface-monitoring
Oct  6 19:43:01 Both the nodes are primary. RG-1 PRIMARY->SECONDARY_HOLD due to preempt/yield, my priority 0 is worse than other node's priority 1
Oct  6 19:43:01 Successfully sent an snmp-trap due to a failover from primary to secondary-hold on RG-1 on cluster 1 node 0. Reason: Monitor failed: IF
Oct  6 19:43:01 updated rg_info for RG-1 with failover-cnt 1 state: secondary-hold into ssam. Result = success, error: 0
Oct  6 19:43:01 reth0 ifd state changed from node0-primary -> node1-primary for RG-1
Oct  6 19:43:01 reth1 ifd state changed from node0-primary -> node1-primary for RG-1
Oct  6 19:43:01 updating primary-node as node1 for RG-1 into ssam. Previous primary was node0. Result = success, 0
Oct  6 19:43:01 Successfully sent an snmp-trap due to a failover from primary to secondary-hold on RG-1 on cluster 1 node 0. Reason: Monitor failed: IF
Oct  6 19:43:01 printing fpc_num h0
Oct  6 19:43:01 jsrpd_ifd_msg_handler: Interface reth0 is up
Oct  6 19:43:01 reth0 from  jsrpd_ssam_reth_read reth_rg_id=1
Oct  6 19:43:01 printing fpc_num h1
Oct  6 19:43:01 jsrpd_ifd_msg_handler: Interface reth1 is up
Oct  6 19:43:01 reth1 from  jsrpd_ssam_reth_read reth_rg_id=1
Oct  6 19:43:02 SECONDARY_HOLD->SECONDARY due to back to back failover timer expiry for RG-1
Oct  6 19:43:02 Successfully sent an snmp-trap due to a failover from secondary-hold to secondary on RG-1 on cluster 1 node 0. Reason: Back to back failover interval expired
Oct  6 19:43:02 updated rg_info for RG-1 with failover-cnt 1 state: secondary into ssam. Result = success, error: 0
Oct  6 19:43:02 Successfully sent an snmp-trap due to a failover from secondary-hold to secondary on RG-1 on cluster 1 node 0. Reason: Back to back failover interval expired
What is interesting is that the SRX is explicitly sending an SNMP trap for these events, so make sure you have a good monitoring tool and trap receiver in place, preferably with alerting.
- As the ultimate test, I will unplug interface fe-1/0/0, the first port of node1, which will make the whole LACP bundle
reth0run on just one link. If we had configuredminimum-links 2this action would bring down the whole reth bundle
After pulling the cable, reth0 is strolling along on just one link:
root@FW01A> show lacp interfaces reth0 | find protocol
    LACP protocol:        Receive State  Transmit State          Mux State
      fe-0/0/0            Port disabled     No periodic           Detached
      fe-0/0/1            Port disabled     No periodic           Detached
      fe-1/0/0            Port disabled     No periodic           Detached
      fe-1/0/1                  Current   Slow periodic Collecting distributing
And the Etherchannel is still up:
root@FW01A> show interfaces terse | match reth0
reth0                   up    up
reth0.111               up    up   inet     1.1.1.1/28
reth0.32767             up    up
root@FW01A> show chassis cluster interfaces | find Monitoring
Interface Monitoring:
    Interface         Weight    Status    Redundancy-group
    fe-1/0/2          128       Up        1
    fe-1/0/3          128       Up        1
    fe-0/0/3          128       Up        1
    fe-0/0/2          128       Up        1
    fe-1/0/1          128       Up        1
    fe-1/0/0          128       Down      1
    fe-0/0/1          128       Down      1
    fe-0/0/0          128       Down      1
For anyone designing a network solution with high-availability in mind, this is all very promising. Even with 75% of our physical links down, the reth will stay functional and forward traffic.
I have now reconnected all cabling for a last question I’ve been pondering about – how does the interface monitor react when physical ports go down on both nodes? Suppose we are running our trunks to a chassis or VSS and lose a linecard or stack-member? Does the interface weight count globally and trigger a failover? Let’s find out…
- Disconnecting fe-0/0/0 and fe-1/0/0, the first port on each node which is in reth0
root@FW01A> show interfaces terse | match "fe-0/0/0|fe-1/0/0"
fe-0/0/0                up    down
fe-0/0/0.111            up    down aenet    --> reth0.111
fe-0/0/0.32767          up    down aenet    --> reth0.32767
fe-1/0/0                up    down
fe-1/0/0.111            up    down aenet    --> reth0.111
fe-1/0/0.32767          up    down aenet    --> reth0.32767
Both links, which both had a weight of 128, are now down but RG1 is still rolling along fine on node0 and the priority is not set to 0. This does prove that the interface-monitor value is tied to the node on which the interface resides.
Redundancy group: 1 , Failover count: 2
    node0                   120         primary        yes      no
    node1                   1           secondary      yes      no
Let’s disconnect fe-0/0/2 and fe-1/0/2 to simulate a really bad day. Our interface monitor now shows half our revenue ports down:
Interface Monitoring:
    Interface         Weight    Status    Redundancy-group
    fe-1/0/2          128       Down      1
    fe-1/0/3          128       Up        1
    fe-0/0/3          128       Up        1
    fe-0/0/2          128       Down      1
    fe-1/0/1          128       Up        1
    fe-1/0/0          128       Down      1
    fe-0/0/1          128       Up        1
    fe-0/0/0          128       Down      1
Interestingly though, both nodes have their priorities now set to zero, but node0 is still primary for RG1.
Redundancy group: 0 , Failover count: 0
    node0                   120         primary        no       no
    node1                   1           secondary      no       no

Redundancy group: 1 , Failover count: 2
    node0                   0           primary        yes      no
    node1                   0           secondary      yes      no
Is there still traffic being sent through though? Running a quick ping from CS2:
NP-CS1#ping 1.1.1.14

Type escape sequence to abort.
Sending 5, 100-byte ICMP Echos to 1.1.1.14, timeout is 2 seconds:
!!!!!
Success rate is 100 percent (5/5), round-trip min/avg/max = 1/3/4 ms
Conclusion
This turned into quite a lengthy post but hopefully demonstrated the benefits of having an Etherchannel over the standard single-port configurations you’ll find in most documentation. Bundling your physical interfaces in a LAG gives you that extra layer of physical redundancy with the added benefit of load sharing on the links. We were able to “lose” 75 percent of our revenue ports without any significant impact. Adding the tagged Layer3 interfaces also gives us the option to add more logical units in the future, which can in turn be assigned to their own routing-instances and zones if you’re dealing with a large-scale or multi-tenant environment.
If this was helpful for you or if you have a remark, please let me know below in the comments! Thanks for reading 🙂
External links that added to my understanding of this topic
Failure is optional – Reth Interfaces and LACP
Juniper KB – Link aggregation (LACP) supported/non-supported configurations on SRX and EX
The free JNCIS-SEC Study Guides at Juniper.net