Outage Report – SRX ALG failure – ‘application failure or action’ logs

The initial complaint came from one of our branch offices, which was having issues reaching internal applications and internet sites. After some troubleshooting, we found that we could no longer query against the remote DNS server, and they could not reach their internal forwarders. First, I wrote it off as a DNS server issue but after more querying to different VPN networks it was clear that all UDP DNS traffic was being lost in transit.

To verify if the packets were going through, I started a packet capture on the LAN interface of the remote firewall and did some DNS queries. Fact, there were no UDP/53 packets arriving over the tunnel. No issues with TCP/53 though. So I enabled logging on this specific tunnel policy and while checking the logs for the DNS, I found these lines instead of the usual RT_FLOW_SESSION_CREATE entries.

2015-09-25 14:19:53	User.Info	10.164.3.70	1 2015-09-25T14:19:53.047 VPN_Box_A RT_FLOW - RT_FLOW_SESSION_CLOSE [junos@2636.1.1.1.2.36 reason="application failure or action" source-address="10.164.242.1" source-port="58358" destination-address="10.10.132.40" destination-port="53" service-name="junos-dns-udp" nat-source-address="10.164.242.1" nat-source-port="58358" nat-destination-address="10.10.132.40" nat-destination-port="53" src-nat-rule-name="None" dst-nat-rule-name="None" protocol-id="17" policy-name="FW-Policy100" source-zone-name="trust" destination-zone-name="untrust" session-id-32="51106" packets-from-client="0" bytes-from-client="0" packets-from-server="0" bytes-from-server="0" elapsed-time="1" application="UNKNOWN" nested-application="UNKNOWN" username="N/A" roles="N/A" packet-incoming-interface="reth0.0" encrypted="No "]

This is not a standard event: RT_FLOW_SESSION_CLOSE [junos@2636.1.1.1.2.36 reason=”application failure or action”

When going through the entire log file for other entries with the “application failure or action” message, I found many more related to RPC and FTP. This immediately pointed to the ALG engine.

2015-09-25 14:19:54	User.Info	10.164.3.70	1 2015-09-25T14:19:53.846 VPN_Box_A RT_FLOW - RT_FLOW_SESSION_CLOSE [junos@2636.1.1.1.2.36 reason="application failure or action" source-address="10.164.110.223" source-port="9057" destination-address="10.104.12.161" destination-port="21" service-name="junos-ftp" nat-source-address="10.9.1.150" nat-source-port="58020" nat-destination-address="10.xx.70.1" nat-destination-port="21" src-nat-rule-name="SNAT-Policy5" dst-nat-rule-name="NAT-Policy10" protocol-id="6" policy-name="FW-FTP" source-zone-name="trust" destination-zone-name="untrust" session-id-32="24311" packets-from-client="0" bytes-from-client="0" packets-from-server="0" bytes-from-server="0" elapsed-time="1" application="UNKNOWN" nested-application="UNKNOWN" username="N/A" roles="N/A" packet-incoming-interface="reth0.0" encrypted="No "]

2015-09-25 14:19:51	User.Info	10.164.3.70	1 2015-09-25T14:19:51.444 VPN_Box_A RT_FLOW - RT_FLOW_SESSION_CLOSE [junos@2636.1.1.1.2.36 reason="application failure or action" source-address="10.164.243.110" source-port="50801" destination-address="10.10.132.50" destination-port="135" service-name="junos-ms-rpc-tcp" nat-source-address="10.164.243.110" nat-source-port="50801" nat-destination-address="10.10.132.50" nat-destination-port="135" src-nat-rule-name="None" dst-nat-rule-name="None" protocol-id="6" policy-name="FW-Policy100" source-zone-name="trust" destination-zone-name="untrust" session-id-32="2317" packets-from-client="0" bytes-from-client="0" packets-from-server="0" bytes-from-server="0" elapsed-time="1" application="UNKNOWN" nested-application="UNKNOWN" username="N/A" roles="N/A" packet-incoming-interface="reth0.0" encrypted="No "]

Coincidentally, we had already received a ticket related to FTP traffic over a different VPN, but the tunnel was up and all other services were open, so we didn’t immediately relate the two cases.

As a quick workaround for DNS, I disabled the DNS ALG. If you want to know what the ALG exactly does, Bart Jansens has a good write-up here. We could live without those features for a while.

{primary:node0}
netprobe@VPN_Box_A> show configuration security alg dns 
disable;

After disabling the ALG, all our DNS queries were going through again. Instead of immediately closing the session when a response is received, the DNS sessions get a 60 second timeout. This gave a few more sessions in the flow table but nothing the SRX couldn’t manage.

The same workaround worked for FTP. Unfortunately, I couldn’t find a quick way to restart the ALG process so I have rebooted the cluster nodes over the weekend. After rebooting, all the services inspected by the ALGs worked as designed again.

*Hostnames, IP addresses and Policy names were changed

JNCIS-SEC – Juniper SRX100 Cluster Configuration

In this post I will go through the basics of cluster configuration on the SRX. I still have a couple of SRX100s laying around, which is perfect to cover the clustering topics of the JNCIS-SEC blueprint!

Before you start configuring the cluster, always verify that both your boxes are on the same software version.

root@FW01A> show system software
Information for junos:

Comment:
JUNOS Software Release [12.1X44-D40.2]

Physical Wiring

Here is how the cluster will be cabled up. Because there’s a lot to remember during the configuration, it’s best to make this sort of diagram before you begin.

SRX100B Cluster Wiring

Connect the fxp1 and Fab ports

The Control link (fxp1) is used to synchronize configuration and performs cluster health checks by sending heartbeat messages. The physical port location depends on the SRX model, and can also be configurable on the high-end models. In my case, on the branch SRX100B, the fe0/0/07 interfaces are predetermined as fxp1.

The fab interface is used to exchange all the session state information between both devices. This provides a stateful failover if anything happens to the primary cluster node. You can choose which interface to assign. I will use fe/0/0/5 so all the first ports stay available.

Setting the Cluster-ID and Node ID

First, wipe all the old configuration and put both devices in cluster mode. Some terminology:

  • The cluster ID ranges from 1 to 15 and uniquely identifies the cluster if you have multiple clusters across the network. I will use Cluster ID 1
  • The node ID identifies both members in the cluster. A cluster will only have two members ever, so the options are 0 and 1

The commands below are entered in operational mode:

root@FW01A> set chassis cluster cluster-id 1 node 0 reboot
Successfully enabled chassis cluster. Going to reboot now
root@FW01B> set chassis cluster cluster-id 1 node 1 reboot
Successfully enabled chassis cluster. Going to reboot now

Keep attention when you enter the commands above. Make sure you are actually enabling the cluster, not disabling it. That would return the following message:

 Successfully disabled chassis cluster. Going to reboot now

Configuring the management interfaces

Once the devices have restarted we can move on to the configuration part.

To get out-of-band access to your firewalls, you really should configure both the members with a managment IP on the fxp0 interface.
All member-specific configuration is applied under the groups node-memmbers stanza. This is also where the hostnames are configured.

{primary:node0}[edit groups]
root@FW01A# show
node0 {
    system {
        host-name FW01A;
    }
    interfaces {
        fxp0 {
            unit 0 {
                family inet {
                    address 192.168.1.1/24;
                }
            }
        }
    }
}
node1 {
    system {
        host-name FW01B;
    }
    interfaces {
        fxp0 {
            unit 0 {
                family inet {
                    address 192.168.1.2/24;
                }
            }
        }
    }
}

On the SRX100B, the fxp0 interface is automatically mapped to the fe0/0/6 interface. Be sure to check the documentation for your specific model.

Apply Group

Before committing, don’t forget to include the command below . This ensures that node-specific config is only applied to that particular node.

{primary:node0}[edit]
root@FW01A# set apply-groups "${node}"

Configuring the fabric interface

The next step is to configure your fabric links, which are used to exchange the session state. Node0 has the fab0 interface and Node1 has the fab1 interface.

{primary:node0}[edit interfaces]
root@FW01A# show
fab0 {
    fabric-options {
        member-interfaces {
            fe-0/0/5;
        }
    }
}
fab1 {
    fabric-options {
        member-interfaces {
            fe-1/0/5;
        }
    }
}

After a commit, we can see both the control and fabric links are up.

root@FW01A# run show chassis cluster interfaces
Control link status: Up

Control interfaces:
    Index   Interface        Status
    0       fxp1             Up

Fabric link status: Up

Fabric interfaces:
    Name    Child-interface    Status
                               (Physical/Monitored)
    fab0    fe-0/0/5           Up   / Up
    fab0
    fab1    fe-1/0/5           Up   / Up
    fab1

Redundant-pseudo-interface Information:
    Name         Status      Redundancy-group
    lo0          Up          0

Configuring the Redundancy Groups

The redundancy group is where you configure the cluster’s failover properties relating to a collection of interfaces or other objects. RG0 is configured by default when you activate the cluster, and manages the redundancy for the routing engines. Let’s create a new RG 1 for our interfaces.

{secondary:node0}[edit chassis]
root@FW01A# show
cluster {
    redundancy-group 0 {
        node 0 priority 100;
        node 1 priority 1;
    }
    redundancy-group 1 {
        node 0 priority 100;
        node 1 priority 1;
    }
}

Configuring Redundant Ethernet interfaces

The reth interfaces are bundles of physical ports across both cluster members. The child interfaces inherit the configuration from the overlying reth interface – think of it as being similar to an 802.3ad Etherchannel. In fact, you can use an Etherchannel to use more than one physical port on each node.

{secondary:node0}[edit chassis cluster]
root@FW01A# set reth-count 2

After entering this command, you can do a quick commit, which will make the reth interfaces visible in the terse command.

root@FW01A# run show interfaces terse | match reth
reth0                   up    down
reth1                   up    down

Now you can configure the reth interfaces as you would with any other interface, give them an IP and assign them to the Redundancy Group.

reth0 is our outside interface, and reth1 is the inside.

{secondary:node0}[edit interfaces]
root@FW01A# show reth0
redundant-ether-options {
    redundancy-group 1;
}
unit 0 {
    family inet {
        address 1.1.1.1/24;
    }
}
{secondary:node0}[edit interfaces]
root@FW01A# show reth1
redundant-ether-options {
    redundancy-group 1;
}
unit 0 {
    family inet {
        address 10.0.0.1/24;
    }
}

When our reths are configured, we can add our physical ports. The fe-0/0/0 (node0) and fe-1/0/0 (node1) will join reth0, fe-0/0/1 and fe-1/0/1 will join reth1.

{secondary:node0}[edit interfaces]
root@FW01A# show
fe-0/0/0 {
    fastether-options {
        redundant-parent reth0;
    }
}
fe-0/0/1 {
    fastether-options {
        redundant-parent reth1;
    }
}
fe-1/0/0 {
    fastether-options {
        redundant-parent reth0;
    }
}
fe-1/0/1 {
    fastether-options {
        redundant-parent reth1;
    }
}

Interface monitoring

We can use interface monitoring to subtract a predetermined priority value off our redundancy group priority, when a link goes physically down.

For example, node0 is primary for RG1 with a priority of 100. If we add an interface-monitor value of anything higher than 100 to the physical interface, the link-down event will cause to priority to drop to zero and trigger the failover. Configuration is applied at the redundancy-groups:

{primary:node0}[edit chassis cluster]
root@FW01A# show
reth-count 2;
redundancy-group 0 {
    node 0 priority 100;
    node 1 priority 1;
}
redundancy-group 1 {
    node 0 priority 100;
    node 1 priority 1;
    preempt;
    gratuitous-arp-count 5;
    interface-monitor {
        fe-0/0/0 weight 255;
        fe-0/0/1 weight 255;
        fe-1/0/0 weight 255;
        fe-1/0/1 weight 255;
    }
}

Finally, we add the interfaces to security zones.

root@FW01A# show security zones
security-zone untrust {
    interfaces {
        reth0.0;
    }
}
security-zone trust {
    host-inbound-traffic {
        system-services {
            ping;
        }
    }
    interfaces {
        reth1.0;
    }
}

Verification

After cabling it up, we can verify that the cluster is fully operational.

root@FW01A> show chassis cluster status
Cluster ID: 1
Node                  Priority          Status    Preempt  Manual failover

Redundancy group: 0 , Failover count: 0
    node0                   100         primary        no       no
    node1                   1           secondary      no       no

Redundancy group: 1 , Failover count: 0
    node0                   100         primary        yes      no
    node1                   1           secondary      yes      no
root@FW01A> show chassis cluster interfaces
Control link status: Up

Control interfaces:
    Index   Interface        Status
    0       fxp1             Up

Fabric link status: Up

Fabric interfaces:
    Name    Child-interface    Status
                               (Physical/Monitored)
    fab0    fe-0/0/5           Up   / Up
    fab0
    fab1    fe-1/0/5           Up   / Up
    fab1

Redundant-ethernet Information:
    Name         Status      Redundancy-group
    reth0        Up          1
    reth1        Up          1

Redundant-pseudo-interface Information:
    Name         Status      Redundancy-group
    lo0          Up          0

Interface Monitoring:
    Interface         Weight    Status    Redundancy-group
    fe-1/0/1          255       Up        1
    fe-1/0/0          255       Up        1
    fe-0/0/1          255       Up        1
    fe-0/0/0          255       Up        1

Let’s see how long the failover takes, by unplugging one of the links in the trust zone.

Pinging from the inside switch to the reth1 address 10.0.0.1

theswitch#ping 10.0.0.1 repeat 10000

Type escape sequence to abort.
Sending 10000, 100-byte ICMP Echos to 10.0.0.1, timeout is 2 seconds:
!!!!!!!!!!!!!!!!!!!!!!!!!!!!!!!!!!!!!!!!!!!!!!!!!!!!!!!!!!!!!!!!!!!!!!
!!!!!!!!!!!!!!!!!!!!!!!!!!!!!!!!!!!!!!!!!!!!!!!!!!!!!!!!!!!!!!!!!!!!!!
!!!!!!.!!!!!!!!!!!!!!!!!!!!!!!!!!!!!!!!!!!!!!!!!!!!!!!!!!!!!!!!!!!!!!!
!!!!!!!!!!!!!!!!!!!!!!!!!!!!!!!!!!!!!!!!!!!!!!!!!!!!!!!!!!!!!!!!!!!!!!

Excellent, only lost one ping while failing over to node1 which would be 2 seconds.

We can see that node1 is now the primary for redundancy group 1, which holds our interfaces:

root@FW01A> show chassis cluster status redundancy-group 1
Cluster ID: 1
Node                  Priority          Status    Preempt  Manual failover

Redundancy group: 1 , Failover count: 3
    node0                   0           secondary      yes      no
    node1                   1           primary        yes      no

{primary:node0}

In the next article, I will dive a bit deeper and integrate the SRX cluster in a real-world topology.

JNCIS-SEC – Custom IDP policies on the Juniper SRX

Activating Intrusion Detection and Prevention (or IPS, as all the cool kids call it) on the SRX is quite straightforward in itself, but turning it on and relying solely on the default IDP policies is not going to cut it. While doing my own tests, running some scriptkiddie attacks against a virtual machine, I was expecting lots of sirens but unfortunately, the SRX stayed silent. No detection and definitely no prevention. As I quickly gathered, you actually need to put some thought in the services you are exposing and the kind of attacks you can expect, and then craft your own policies with the specific signatures.

For this one, I’ll be creating a custom IDP rule on the vSRX. I’m assuming you have already set up the vSRX, activated the advanced features license and set up IDP. If not, here are some links that will put you on the right path.

Scenario

  • We are hosting an SSH/SFTP server on my public IP address of 1.1.1.10/32. Every day, there are hundreds of brute-force login attempts. Obviously, the server admin has not implemented protective measures so we will try to reduce the impact by enabling IDP.
  • Destination NAT has been configured and is translating 1.1.1.10 to internal DMZ server 10.0.4.10.

Here is the firewall configuration. IDP has already been enabled on this policy.

[edit security policies from-zone untrust to-zone dmz policy FW-SFTP-Servers]
root@NP-vSRX-01# show
match {
    source-address any;
    destination-address Grp-SFTP-Servers;
    application junos-ssh;
}
then {
    permit {
        application-services {
            idp;
        }
    }
    log {
        session-init;
    }
}

Server setup and brute-force script

I’m using this script which runs a txt file of common passwords against the username specified.

On the linux server, let’s create a user, aptly named “admin”, with one of the passwords from the text files

lab@V104-10:~$ sudo useradd admin
lab@V104-10:~$ sudo passwd admin
Enter new UNIX password:
Retype new UNIX password:
passwd: password updated successfully

First, running the script with the standard IDP policy of Server-Protection-1G

lab@V120-10:/tmp/brutessh$ python brutessh.py -h 1.1.1.10 -u admin -d passlist.txt

*************************************
*SSH Bruteforcer Ver. 0.2           *
*Coded by Christian Martorella      *
*Edge-Security Research             *
*laramies@gmail.com                 *
*************************************

HOST: 1.1.1.10 Username: admin Password file: passlist.txt
===========================================================================
Trying password...
miller


Auth OK ---> Password Found: changeme
tiger

Times -- > Init: 0.032772 End: 6.861204

The SRX was not paying attention during the attack -nothing in the attack table- and the server got owned.

root@NP-vSRX-01> show security idp attack table
root@NP-vSRX-01>

Rolling your own IDP rules

Unfortunately, the server guy had to be let go and we are now looking for a way to be prevent these kinds of attacks. Of course, the first thing to do would be to harden the server and enforce strong credentials, but it does help if you are notified of an ongoing attack. Even better if the SRX could also prevent or slow down the attack.

For our scenario, we are specifically looking for SSH Brute-force attacks. A good way to find out if the SRX has an on-board signature for this is to browse the attack database. You can find all these signatures in operational mode.

root@NP-vSRX-01# run show security idp attack description SSH?
Possible completions:
          Attack name
  SSH:AUDIT:SSH-V1
  SSH:AUDIT:UNEXPECTED-HEADER
  SSH:BRUTE-LOGIN
  SSH:ERROR:COOKIE-MISMATCH
  SSH:ERROR:INVALID-HEADER
  SSH:ERROR:INVALID-PKT-TYPE
  SSH:ERROR:MSG-TOO-LONG
  SSH:ERROR:MSG-TOO-SHORT
  SSH:MISC:EXPLOIT-CMDS-UNIX
  SSH:MISC:MAL-VERSION
  SSH:MISC:UNIX-ID-RESP
  SSH:NON-STD-PORT
  SSH:OPENSSH-MAXSTARTUP-DOS
  SSH:OPENSSH:BLOCK-DOS
  SSH:OPENSSH:GOODTECH-SFTP-BOF
  SSH:OPENSSH:NOVEL-NETWARE
  SSH:OVERFLOW:FREESSHD-KEY-OF
  SSH:OVERFLOW:PUTTY-VER
  SSH:OVERFLOW:SECURECRT-BOF
  SSH:PRAGMAFORT-KEY-OF
  SSH:SYSAX-MULTI-SERVER-DOS
  SSH:SYSAX-SERVER-DOS

root@NP-vSRX-01# run show security idp attack description SSH:BRUTE-LOGIN
Description: This signature detects attempts by remote attackers to log in to an SSH server by brute-forcing the password.

Another great resource for finding the right signature is this page.

If you are using one of the predefined IDP policy sets, navigate down and edit the configuration. I am using Server-Protection-1G on mine.

The policy below will detect SSH brute-force attempts and, by using the ip-action, block the source IP for 30 minutes. That should slow ’em down.

[edit security idp idp-policy Server-Protection-1G rulebase-ips]
root@NP-vSRX-01# show rule SSH-SFTP-Services
match {
    from-zone any;
    source-address any;
    to-zone any;
    destination-address any;
    application default;
    attacks {
        predefined-attacks SSH:BRUTE-LOGIN;
    }
}
then {
    action {
        close-client;
    }
    ip-action {
        ip-block;
        target source-address;
        timeout 1800;
    }
    notification {
        log-attacks;
    }
}

You can rearrange the rules by using the insert policy before

Testing the policy

Running the script for a second time, it only took a small number of brute-force attempts until the alarm triggered. After a minute or two of time-outs, the script gave up and started spawning python errors.

lab@V120-10:/tmp/brutessh$ python brutessh.py -h 1.1.1.10 -u admin -d passlist.txt

*************************************
*SSH Bruteforcer Ver. 0.2           *
*Coded by Christian Martorella      *
*Edge-Security Research             *
*laramies@gmail.com                 *
*************************************

HOST: 1.1.1.10 Username: admin Password file: passlist.txt
===========================================================================
Trying password...
abc123
Exception in thread carmen
:
Traceback (most recent call last):
  File "/usr/lib/python2.7/threading.py", line 810, in __bootstrap_inner
    self.run()
  File "brutessh.py", line 44, in run
    t = paramiko.Transport(hostname)
  File "/tmp/brutessh/paramiko/transport.py", line 235, in __init__
    sock.connect((hostname, port))
  File "/usr/lib/python2.7/socket.py", line 224, in meth
    return getattr(self._sock,name)(*args)
error: [Errno 110] Connection timed out
Exception in thread test
:
Traceback (most recent call last):
  File "/usr/lib/python2.7/threading.py", line 810, in __bootstrap_inner
    self.run()
  File "brutessh.py", line 44, in run
    t = paramiko.Transport(hostname)
  File "/tmp/brutessh/paramiko/transport.py", line 235, in __init__
    sock.connect((hostname, port))
  File "/usr/lib/python2.7/socket.py", line 224, in meth
    return getattr(self._sock,name)(*args)
error: [Errno 110] Connection timed out
Exception in thread password1
:

Some verification commands on the SRX itself.

root@NP-vSRX-01> show security log | match IDP:
2015-09-17 19:22:45 UTC  IDP: at 1442517764, SIG Attack log <2.2.2.1/6768->1.1.1.10/22> for TCP protocol and service SERVICE_IDP application NONE by rule 6 of rulebase IPS in policy Server-Protection-1G. attack: repeat=0, action=CLOSE_CLIENT, threat-severity=MEDIUM, name=SSH:BRUTE-LOGIN, NAT <0.0.0.0:0->10.0.4.10:0>, time-elapsed=0, inbytes=0, outbytes=0, inpackets=0, outpackets=0, intf:untrust:ge-0/0/0.0->dmz:ge-0/0/2.0, packet-log-id: 0, alert=no, username=N/A, roles=N/A and misc-message -

The SRX detected three login attempts through before shunning the remote IP

root@NP-vSRX-01> show security idp attack table
IDP attack statistics:

  Attack name                                  #Hits
  SSH:BRUTE-LOGIN                              3
root@NP-vSRX-01> show security idp attack detail SSH:BRUTE-LOGIN
Display Name: SSH: Brute Force Login Attempt
Severity: Minor
Category: SSH
Recommended: true
Recommended Action: Drop
Type: signature
Direction: CTS
False Positives: rarely
Service: SSH
Shellcode: no
Flow: control
Context: first-data-packet
Negate: false
TimeBinding:
        Scope: peer
        Count: 10
Hidden Pattern: False
Pattern: \[SSH\].*
root@NP-vSRX-01> show security idp counters action
IDP counters:

  IDP counter type                                                      Value
 None                                                                    0
 Recommended                                                             0
 Ignore                                                                  0
 Diffserv                                                                0
 Drop packet                                                             0
 Drop                                                                    0
 Close                                                                   0
 Close server                                                            0
 Close client                                                            3
 IP action rate limit                                                    0
 IP action drop                                                          3
 IP action close                                                         0
 IP action nofity                                                        0
 IP action failed                                                        0

Wrapping up

Although very basic, this example demonstrated that it absolutely pays off to invest some time in crafting your own IDP rules. Keeping a detailed inventory of the services you are hosting and matching it against the associated application-level attack signatures will greatly increase your security posture. Combined with the Screen Options, which protect against some of the L3/L4 attacks, this makes the SRX well worth considering 🙂

Route-based IPsec tunnels on the SRX

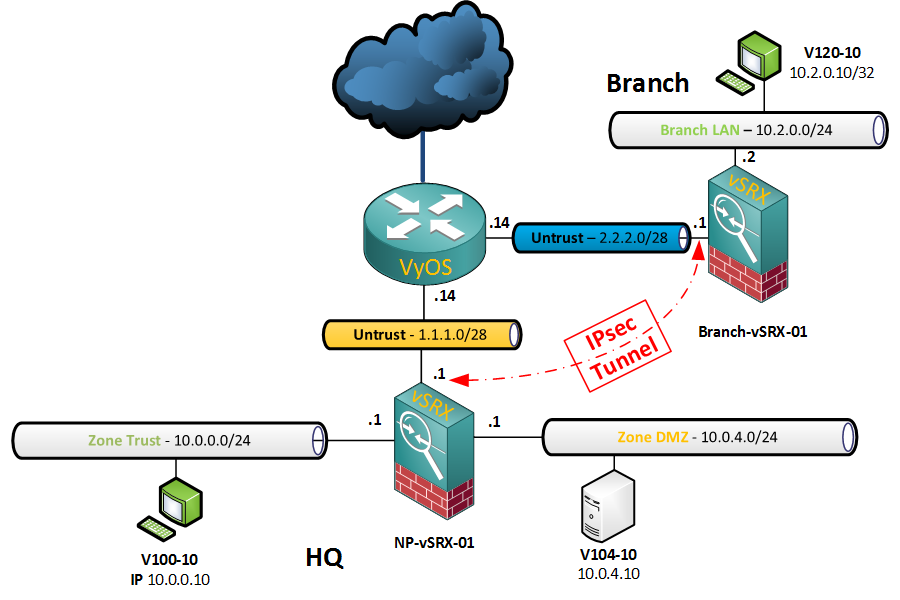
Expanding on the basic branch setup from my previous labs, I added another virtual SRX to the topology to exercise the VPN stuff. As the “ISP” router, I first tried adding a CSR-1000V to the lab but found out the hard way that it’s bandwidth throttled at 100kbps. With six virtual machines behind it sporadically fetching stuff off the internet, the entire lab came to a grinding halt. 🙂

As a quick workaround, I settled on a VyOS appliance , which was surprisingly easy to work with. It’s very similar to JunOS so I had it up and running in just a couple of minutes.

Anyway, enough about that. Here’s the network I’ll be working off to build some VPNs…

Topology

VPN Topology

Before you configure VPN tunnels, make sure that your public interface is listening for IKE traffic. This is defined on the zone or interface level.

[edit security zones security-zone untrust]
root@NP-vSRX-01# show
host-inbound-traffic {
    system-services {
        ssh;
        ping;
        ike;
    }
}
interfaces {
    ge-0/0/0.0;
}

Tunnel interface, routing and security zone

First, define a Secure Tunnel interface with IPv4 support by adding the inet family. If you forget the family inet statement, your tunnel will not pass traffic.

For simple tunnels without dynamic routing protocols, assigning an IP address is not required.

[edit interfaces]
root@NP-vSRX-01# show st0
unit 1 {
    description "Branch1 Tunnel Interface";
    family inet;
}

Create a static route for the peer subnet(s) and point it to the tunnel interface.

[edit]
root@NP-vSRX-01# set routing-options static route 10.2.0.0/24 next-hop st0.1

One thing I tend to forget is to add the st0 interface to the right security zone. Rather than putting it in the untrust zone, I will create a separate zone for VPN and put the tunnel there.

[edit security zones security-zone vpn]
root@NP-vSRX-01# show
interfaces {
    st0.1;
}

Once that is done, we can start configuring the actual VPN policy. There are a lot of components to configure, but once you know how they intertwine it’s pretty straightforward.

Configuring Phase 1

First, configure an IKE proposal. You could choose one of the JunOS templates, but where’s the fun in that, right? 🙂

[edit security ike]
root@NP-vSRX-01# show
proposal P1-Proposal-Branch1 {
    description "Branch1 Phase1 Proposal";
    authentication-method pre-shared-keys;
    authentication-algorithm sha-256;
    encryption-algorithm aes-256-cbc;
    lifetime-seconds 43200;
}

Once we have the P1 proposal, we define the phase 1 policy which in turn refers to the proposal. Unless your peer has a dynamic IP, main mode is what you need. This is also where you specify the preshared key.

[edit security ike policy P1-Policy-Branch1]
root@NP-vSRX-01# show
mode main;
description "Branch1 Phase1 Policy";
proposals P1-Proposal-Branch1;
pre-shared-key ascii-text "$9$DDH.f9CuB1hqMORhcle4aZGjq"; ## SECRET-DATA

Third and last for Phase 1 template, configure the gateway peer IP address with the corresponding policy. If possible, always use IKE version 2. The external interface is where the SRX can expect the UDP/500 packets.

[edit security ike gateway P1-Peer-Branch1]
root@NP-vSRX-01# show
ike-policy P1-Policy-Branch1;
address 2.2.2.1;
external-interface ge-0/0/0;
version v2-only;

Now that Phase1 is set, we can move on to the IPsec configuration.

Phase 2 – IPsec

Just as we did before, we first define a proposal. Choose your most secure option for encryption and hashing, and a reasonably short keying lifetime.

[edit security ipsec proposal P2-Proposal-Branch1]
root@NP-vSRX-01# show
description "Branch1 Phase2 Proposal";
protocol esp;
authentication-algorithm hmac-sha-256-128;
encryption-algorithm aes-256-cbc;
lifetime-seconds 3600;

Configure the IPsec policy that again refers to the proposal. Unless the peer does not support it, always turn on PFS.

[edit security ipsec policy P2-Policy-Branch1]
root@NP-vSRX-01# show
description "Branch1 Phase2 Policy";
perfect-forward-secrecy {
    keys group5;
}
proposals P2-Proposal-Branch1;

The final step is where the Phase 1 and 2 components are glued together. For route-based tunnels, don’t forget to bind your st interface. I prefer to negotiate the tunnels immediately rather than waiting for traffic.

[edit security ipsec vpn P2-IPsec-Branch1]
root@NP-vSRX-01# show
bind-interface st0.1;
ike {
    gateway P1-Peer-Branch1;
    ipsec-policy P2-Policy-Branch1;
}
establish-tunnels immediately;

Security Policies

From a VPN point of view, we are ready to accept IPsec connections on this box. We are listening for IKE traffic, we have a route pointing to our tunnel interface and VPN policies are configured. The only thing we need to do is configure the firewall policies.

For this one, I will be allowing traffic from the remote sites to one of the machines on the trust zone. I already created some objects in the global address book.

From VPN to Trust:

[edit security policies from-zone vpn to-zone trust]
root@NP-vSRX-01# show
policy FW-Allow-VPN-Branch {
    match {
        source-address Host-10.2.0.10;
        destination-address Host-10.0.0.10;
        application any;
    }
    then {
        permit;
        count;
    }
}

From Trust to VPN:

[edit security policies]
root@NP-vSRX-01# show from-zone trust to-zone vpn
policy FW-Allow-VPN-Branch {
    match {
        source-address Host-10.0.0.10;
        destination-address Host-10.2.0.10;
        application any;
    }
    then {
        permit;
        count;
    }
}

Configuring the Branch site SRX

The benefit of having two SRX’s is that you can easily copy-paste, edit and mirror the config.

### PHASE 1 ### 

set security ike proposal P1-Proposal-HQ description "HQ Phase1 Proposal"
set security ike proposal P1-Proposal-HQ authentication-method pre-shared-keys
set security ike proposal P1-Proposal-HQ authentication-algorithm sha-256
set security ike proposal P1-Proposal-HQ encryption-algorithm aes-256-cbc
set security ike proposal P1-Proposal-HQ lifetime-seconds 43200
set security ike policy P1-Policy-HQ mode main
set security ike policy P1-Policy-HQ description "HQ Phase1 Policy"
set security ike policy P1-Policy-HQ proposals P1-Proposal-HQ
set security ike policy P1-Policy-HQ pre-shared-key ascii-text "$9$DDH.f9CuB1hqmORhcle4aZGjq"
set security ike gateway P1-Peer-HQ ike-policy P1-Policy-HQ
set security ike gateway P1-Peer-HQ address 1.1.1.1
set security ike gateway P1-Peer-HQ external-interface ge-0/0/0

### PHASE 2 ####

set security ipsec proposal P2-Proposal-HQ description "HQ Phase2 Proposal"
set security ipsec proposal P2-Proposal-HQ protocol esp
set security ipsec proposal P2-Proposal-HQ authentication-algorithm hmac-sha-256-128
set security ipsec proposal P2-Proposal-HQ encryption-algorithm aes-256-cbc
set security ipsec proposal P2-Proposal-HQ lifetime-seconds 3600
set security ipsec policy P2-Policy-HQ description "HQ Phase2 Policy"
set security ipsec policy P2-Policy-HQ perfect-forward-secrecy keys group5
set security ipsec policy P2-Policy-HQ proposals P2-Proposal-HQ
set security ipsec vpn P2-IPsec-HQ bind-interface st0.1
set security ipsec vpn P2-IPsec-HQ ike gateway P1-Peer-HQ
set security ipsec vpn P2-IPsec-HQ ike ipsec-policy P2-Policy-HQ

#### TUNNEL INTERFACE ### 

set interfaces st0 unit 1 description "HQ Tunnel Interface"
set interfaces st0 unit 1 family inet

### HOST INBOUND TRAFFIC ### 

set security zones security-zone untrust host-inbound-traffic system-services ike

### ADD TUNNEL TO ZONE ###

set security zones security-zone untrust interfaces st0.1

### ADD ROUTE ###

set routing-options static route 10.0.0.0/24 next-hop st0.1
set routing-options static route 10.0.4.0/24 next-hop st0.1

### SECURITY POLICIES ### 

set security policies from-zone vpn to-zone branch policy FW-Allow-VPN-HQ-In match source-address Host-10.0.0.10
set security policies from-zone vpn to-zone branch policy FW-Allow-VPN-HQ-In match destination-address Host-10.2.0.10
set security policies from-zone vpn to-zone branch policy FW-Allow-VPN-HQ-In match application any
set security policies from-zone vpn to-zone branch policy FW-Allow-VPN-HQ-In then permit
set security policies from-zone vpn to-zone branch policy FW-Allow-VPN-HQ-In then count
set security policies from-zone branch to-zone vpn policy FW-Allow-VPN-HQ-Server match source-address Host-10.2.0.10
set security policies from-zone branch to-zone vpn policy FW-Allow-VPN-HQ-Server match destination-address Host-10.0.0.10
set security policies from-zone branch to-zone vpn policy FW-Allow-VPN-HQ-Server match application any
set security policies from-zone branch to-zone vpn policy FW-Allow-VPN-HQ-Server then permit
set security policies from-zone branch to-zone vpn policy FW-Allow-VPN-HQ-Server then count

Verification

On the HQ SRX, we already have a phase 1 tunnel up using IKEv2 as the exchange protocol.

root@NP-vSRX-01> show security ike security-associations
Index   State  Initiator cookie  Responder cookie  Mode           Remote Address
2441630 UP     2fb27eba88550b6b  e8b7c6a94c94f8d2  IKEv2          2.2.2.1

We also have a Phase 2 tunnel, with just under one hour of lifetime left.

root@NP-vSRX-01> show security ipsec security-associations
  Total active tunnels: 1
  ID    Algorithm       SPI      Life:sec/kb  Mon lsys Port  Gateway
  <131073 ESP:aes-cbc-256/sha256 14b32bcb 3433/ unlim - root 500 2.2.2.1
  >131073 ESP:aes-cbc-256/sha256 fef69f20 3433/ unlim - root 500 2.2.2.1

Some more details about the IPsec parameters, like Proxy IDs (0.0.0.0/0) and encryption/authentication standards.

root@NP-vSRX-01> show security ipsec security-associations index 131073 detail
  ID: 131073 Virtual-system: root, VPN Name: P2-IPsec-Branch1
  Local Gateway: 1.1.1.1, Remote Gateway: 2.2.2.1
  Local Identity: ipv4_subnet(any:0,[0..7]=0.0.0.0/0)
  Remote Identity: ipv4_subnet(any:0,[0..7]=0.0.0.0/0)
  Version: IKEv2
    DF-bit: clear
    Bind-interface: st0.1

  Port: 500, Nego#: 32, Fail#: 0, Def-Del#: 0 Flag: 0x600a29
  Last Tunnel Down Reason: Delete payload received
    Direction: inbound, SPI: 14b32bcb, AUX-SPI: 0
                              , VPN Monitoring: -
    Hard lifetime: Expires in 3339 seconds
    Lifesize Remaining:  Unlimited
    Soft lifetime: Expires in 2752 seconds
    Mode: Tunnel(0 0), Type: dynamic, State: installed
    Protocol: ESP, Authentication: hmac-sha256-128, Encryption: aes-cbc (256 bits)
    Anti-replay service: counter-based enabled, Replay window size: 64

    Direction: outbound, SPI: fef69f20, AUX-SPI: 0
                              , VPN Monitoring: -
    Hard lifetime: Expires in 3339 seconds
    Lifesize Remaining:  Unlimited
    Soft lifetime: Expires in 2752 seconds
    Mode: Tunnel(0 0), Type: dynamic, State: installed
    Protocol: ESP, Authentication: hmac-sha256-128, Encryption: aes-cbc (256 bits)
    Anti-replay service: counter-based enabled, Replay window size: 64

A good way to verify that there’s two-way communication is to inspect the IPsec counters

root@NP-vSRX-01> show security ipsec statistics index 131073
ESP Statistics:
  Encrypted bytes:        140965904
  Decrypted bytes:       3342178434
  Encrypted packets:        1132200
  Decrypted packets:        2245688
AH Statistics:
  Input bytes:                    0
  Output bytes:                   0
  Input packets:                  0
  Output packets:                 0
Errors:
  AH authentication failures: 0, Replay errors: 251
  ESP authentication failures: 0, ESP decryption failures: 0
  Bad headers: 0, Bad trailers: 0

The ultimate test is to verify on the internal machines. Note the asterisks on the tunnel segment. If there’s an address assigned to the st interface, this one would show in the trace results.

root@Branch-vSRX-01> ssh lab@10.2.0.10
lab@10.2.0.10's password:
Welcome to Ubuntu 14.10 (GNU/Linux 3.16.0-23-generic x86_64)

 * Documentation:  https://help.ubuntu.com/

Last login: Thu Sep 10 22:27:33 2015
lab@V120-10:~$ ping 10.0.0.10
PING 10.0.0.10 (10.0.0.10) 56(84) bytes of data.
64 bytes from 10.0.0.10: icmp_seq=1 ttl=62 time=10.3 ms
64 bytes from 10.0.0.10: icmp_seq=2 ttl=62 time=13.5 ms
64 bytes from 10.0.0.10: icmp_seq=3 ttl=62 time=11.6 ms
^C
--- 10.0.0.10 ping statistics ---
3 packets transmitted, 3 received, 0% packet loss, time 2003ms
rtt min/avg/max/mdev = 10.370/11.869/13.567/1.318 ms

lab@V120-10:~$ traceroute 10.0.0.10
traceroute to 10.0.0.10 (10.0.0.10), 30 hops max, 60 byte packets
 1  10.2.0.1 (10.2.0.1)  3.864 ms  3.912 ms  4.003 ms
 2  * * *
 3  10.0.0.10 (10.0.0.10)  13.682 ms  13.679 ms  13.666 ms
lab@V120-10:~$

That’s it, a fully functional, although very basic, route-based VPN.

JNCIS-SEC – SRX Static NAT Configuration

I already went into source and destination NAT in the last few posts. The last one I wanted to lab up is Static NAT, which creates a one-to-one mapping between two addresses. The translation is bidirectional and ports are not translated. On the downside, it does require you to sacrifice one public IP per internal server which is not always the most cost-efficient method.

Here’s what I’ll be working on:

SRX NAT topology

The following Static NAT entries will be configured:

  • Server 10.0.100.10 will be translated to 1.1.1.10
  • Server 10.0.100.11 will be translated to 1.1.1.11

Using the Global Address Book

Instead of using regular IP prefixes as matching conditions, I will be using address book entries in the NAT config. Referring to the same names in both security policy and NAT makes interpreting and troubleshooting the config much more straightforward.

First, navigate over to the global address book under Security, and enter addresses as you would under the zones. I am creating objects for both the public and private addresses:

[edit security address-book global]
root@NP-vSRX-01# show
address Host-Private-10.0.100.10 10.0.100.10/32;
address Host-Private-10.0.100.11 10.0.100.11/32;
address Host-Public-1.1.1.10 1.1.1.10/32;
address Host-Public-1.1.1.11 1.1.1.11/32;

Caution, when you start adding entries to the global address book, the SRX will start spawning this error when trying a commit:

[edit security zones security-zone untrust]
root@NP-vSRX-01# show
##
## Warning: Zone specific address books are not allowed when there are global address books defined
##

From the looks of it, you will need to move all your zone address books over to the global one, so make sure you start off right on a new SRX. Worst case, you can still match on regular IP prefixes for NAT.

Next will be to define a ruleset, and create some rules. One thing to keep in mind is that you configure the NAT rule to match on the destination address to perform the NAT. Implicitly, the SRX will then create a reverse source-NAT mapping. Just imagine the traffic entering your network, and to what address it should be translated, and the SRX will take care of the reverse traffic for you.

Here is the configuration for the first host, referencing the object name by using destination-address-name:

[edit security nat static]
root@NP-vSRX-01# show
rule-set Static-From-Untrust {
    from zone untrust;
    rule NAT-DMZ-10 {
        match {
            destination-address-name Host-Public-1.1.1.10;
        }
        then {
            static-nat {
                prefix-name {
                    Host-Private-10.0.100.10;
                }
            }
        }
    }
}

Copy paste for the second host:

rule NAT-DMZ-11 {
    match {
        destination-address-name Host-Public-1.1.1.11;
    }
    then {
        static-nat {
            prefix-name {
                Host-Private-10.0.100.11;
            }
        }
    }
}

Verification

The most useful command for Static NAT verification is show security nat static rule, which shows you both a config overview and a hit count.

root@NP-vSRX-01> show security nat static rule all
Total static-nat rules: 2
Total referenced IPv4/IPv6 ip-prefixes: 4/0

Static NAT rule: NAT-DMZ-10           Rule-set: Static-From-Untrust
  Rule-Id                    : 1
  Rule position              : 1
  From zone                  : untrust
  Destination addresses      : Host-Public-1.1.1.10
  Host addresses             : Host-Private-10.0.100.10
  Netmask                    : 32
  Host routing-instance      : N/A
  Translation hits           : 40
    Successful sessions      : 34
    Failed sessions          : 6
  Number of sessions         : 0

Static NAT rule: NAT-DMZ-11           Rule-set: Static-From-Untrust
  Rule-Id                    : 2
  Rule position              : 2
  From zone                  : untrust
  Destination addresses      : Host-Public-1.1.1.11
  Host addresses             : Host-Private-10.0.100.11
  Netmask                    : 32
  Host routing-instance      : N/A
  Translation hits           : 112
    Successful sessions      : 112
    Failed sessions          : 0
  Number of sessions         : 0

To emphasize that no PAT is performed, here is an output of the session table. We are using port 50973 on both ends of the firewall.

Session ID: 15148, Policy name: FW-PermitWeb/7, Timeout: 4, Valid
  In: 10.0.100.11/50973 --> 91.189.92.200/80;tcp, If: ge-0/0/1.0, Pkts: 26, Bytes: 5673
  Out: 91.189.92.200/80 --> 1.1.1.11/50973;tcp, If: ge-0/0/0.0, Pkts: 25, Bytes: 5863