Tag Archives: vSRX

JNCIP-SEC – Configuring Juniper Enhanced Web Filtering

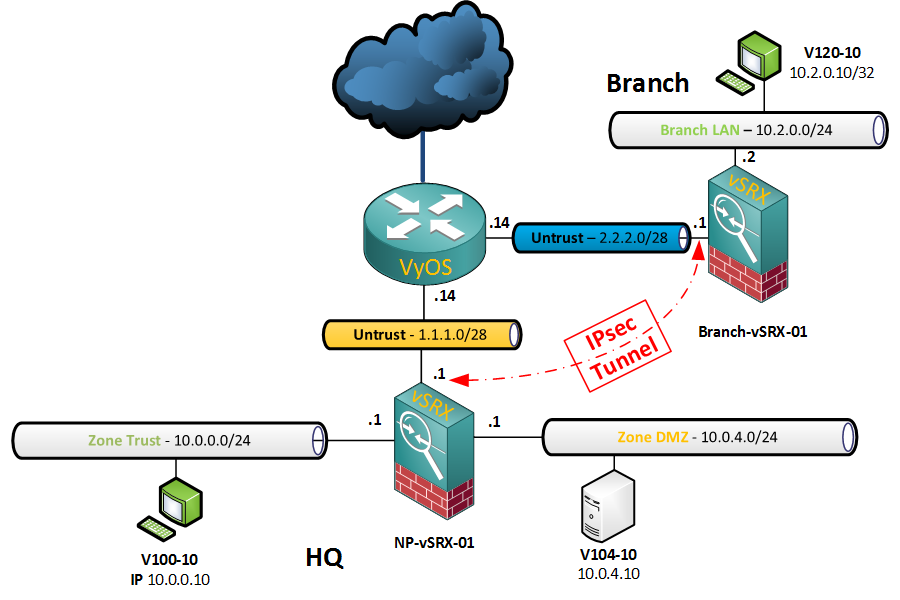
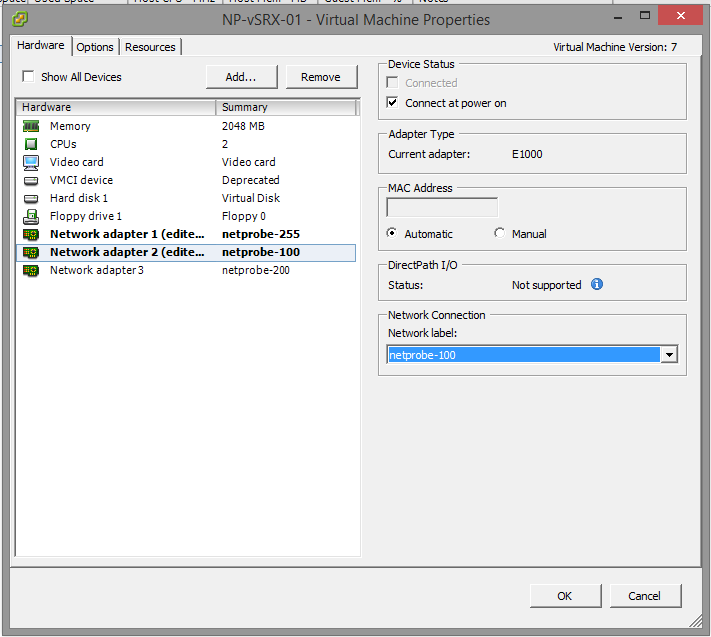
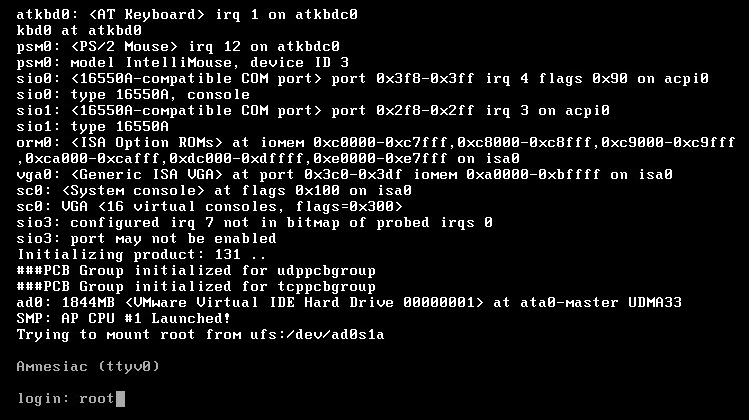
Two more weeks left to take the JNCIP-SEC exam, or I will lose my JNCIS-SEC credentials. I have a fully loaded SRX320 cluster (with advanced feature licenses) and a vSRX in place so I need to lab up quickly. First feature on the list is Juniper Enhanced Web filtering.

Before you begin the configuration, make sure you meet the following prerequisites:

  • The device has a valid wf_key_websense_ewf license
  • The egress interface has internet connectivity
  • The device has working name-servers defined
  • If you are enabling the feature on a virtual router, be sure to define the VR under [edit security utm feature-profile web-filtering]

To activate the Juniper Enhanced Web Filtering feature, enter the following command:

[edit security utm feature-profile web-filtering]
root@NP-vSRX# show
type juniper-enhanced;

Next, enable the UTM feature profile for Juniper Enhanced Web Filtering and configure the Juniper-managed Websense server URL.

[edit security utm feature-profile web-filtering]
root@NP-vSRX# show
juniper-enhanced {
    server {
        host rp.cloud.threatseeker.com;
        port 80;
    }
}

Before we configure the Websense categories, we should define custom whitelists and blacklists, which can be used to overrule unexpected results from the automated Websense categorization.

Under the UTM custom-objects, we’ll create an URL pattern for one of our favorite networking-related forums and for a blacklisted adult site. These are then addded to custom black/whitelist categories.

[edit security utm custom-objects]
root@NP-vSRX# show
url-pattern {
    URL-networking-forumsdotcom {
        value [ http://networking-forums.com 64.90.58.116 ];
    }
    URL-sexdotcom {
        value [ sex.com 206.125.164.82 ];
    }
}
custom-url-category {
    EWF-Blacklist {
        value URL-sexdotcom;
    }
    EWF-Whitelist {
        value URL-networking-forumsdotcom;
    }
}

Our two custom URL categories are added under the global web-filtering configuration.

[edit security utm feature-profile web-filtering]
root@NP-vSRX# show
url-whitelist EWF-Whitelist;
url-blacklist EWF-Blacklist;

As for the Enhanced Web-filtering example, I’ll create one profile for standard internet access called “WF-DefaultInternetAccess”. Adult content and malicious URLs/IP addresses will be blocked by default and some ‘undesirable’ categories will be allowed, yet a security event will be logged. The default action will be set to “permit”.

[edit security utm feature-profile web-filtering juniper-enhanced]
root@NP-vSRX# show
cache;
server {
    host rp.cloud.threatseeker.com;
    port 80;
}
profile WF-DefaultInternetAccess {
    category {
        Enhanced_Adult_Content {
            action block;
        }
        Enhanced_Adult_Material {
            action block;
        }
        Enhanced_Advanced_Malware_Command_and_Control {
            action block;
        }
        Enhanced_Advanced_Malware_Payloads {
            action block;
        }
        Enhanced_Bot_Networks {
            action block;
        }
        Enhanced_Dynamic_DNS {
            action block;
        }
        Enhanced_Emerging_Exploits {
            action block;
        }
        Enhanced_Keyloggers {
            action block;
        }
        Enhanced_Malicious_Embedded_Link {
            action block;
        }
        Enhanced_Malicious_Embedded_iFrame {
            action block;
        }
        Enhanced_Malicious_Web_Sites {
            action block;
        }
        Enhanced_Mobile_Malware {
            action block;
        }
        Enhanced_Parked_Domain {
            action block;
        }
        Enhanced_Phishing_and_Other_Frauds {
            action block;
        }
        Enhanced_Proxy_Avoidance {
            action block;
        }
        Enhanced_Spyware {
            action block;
        }
        Enhanced_Abused_Drugs {
            action log-and-permit;
        }
        Enhanced_Alcohol_and_Tobacco {
            action log-and-permit;
        }
        Enhanced_Drugs {
            action log-and-permit;
        }
        Enhanced_Gambling {
            action log-and-permit;
        }
        Enhanced_Games {
            action log-and-permit;
        }
        Enhanced_Hacking {
            action log-and-permit;
        }
        Enhanced_Illegal_or_Questionable {
            action log-and-permit;
        }
        Enhanced_Nudity {
            action log-and-permit;
        }
        Enhanced_Racism_and_Hate {
            action log-and-permit;
        }
        Enhanced_Sex {
            action log-and-permit;
        }
    }
    default permit;
    fallback-settings {
        default log-and-permit;
        server-connectivity block;
        timeout block;
        too-many-requests block;
    }
}

In case a URL does not have a category assigned but only a Web Reputation Score (WBRS) we can define an action based on that score.

Note – the scores are weighted as follows:

  • 100-90–Site is considered very safe.
  • 80-89–Site is considered moderately safe.
  • 70-79–Site is considered fairly safe.
  • 60-69–Site is considered suspicious.
  • 0-59–Site is considered harmful.
[edit security utm feature-profile web-filtering juniper-enhanced profile WF-DefaultInternetAccess site-reputation-action]
root@NP-vSRX# show
very-safe permit;
moderately-safe permit;
fairly-safe log-and-permit;
suspicious quarantine;
harmful block;

For some special cases, in which the device might not be able to process the HTTP request, we can define fallback options. This basically equates to a fail-open/fail-closed decision.

[edit security utm feature-profile web-filtering juniper-enhanced profile WF-DefaultInternetAccess fallback-settings]
root@NP-vSRX# show
default log-and-permit;
server-connectivity block;
timeout block;
too-many-requests block;

With most pieces in place, the full web-filtering profile looks like this:

[edit security utm feature-profile]
root@NP-vSRX# show
web-filtering {
    url-whitelist EWF-Whitelist;
    url-blacklist EWF-Blacklist;
    type juniper-enhanced;
    juniper-enhanced {
        cache;
        server {
            host rp.cloud.threatseeker.com;
            port 80;
        }
        profile WF-DefaultInternetAccess {
            category {
                Enhanced_Adult_Content {
                    action block;
                }
                Enhanced_Adult_Material {
                    action block;
                }
                Enhanced_Advanced_Malware_Command_and_Control {
                    action block;
                }
                Enhanced_Advanced_Malware_Payloads {
                    action block;
                }
                Enhanced_Bot_Networks {
                    action block;
                }
                Enhanced_Dynamic_DNS {
                    action block;
                }
                Enhanced_Emerging_Exploits {
                    action block;
                }
                Enhanced_Keyloggers {
                    action block;
                }
                Enhanced_Malicious_Embedded_Link {
                    action block;
                }
                Enhanced_Malicious_Embedded_iFrame {
                    action block;
                }
                Enhanced_Malicious_Web_Sites {
                    action block;
                }
                Enhanced_Mobile_Malware {
                    action block;
                }
                Enhanced_Parked_Domain {
                    action block;
                }
                Enhanced_Phishing_and_Other_Frauds {
                    action block;
                }
                Enhanced_Proxy_Avoidance {
                    action block;
                }
                Enhanced_Spyware {
                    action block;
                }
                Enhanced_Abused_Drugs {
                    action log-and-permit;
                }
                Enhanced_Alcohol_and_Tobacco {
                    action log-and-permit;
                }
                Enhanced_Drugs {
                    action log-and-permit;
                }
                Enhanced_Gambling {
                    action log-and-permit;
                }
                Enhanced_Games {
                    action log-and-permit;
                }
                Enhanced_Hacking {
                    action log-and-permit;
                }
                Enhanced_Illegal_or_Questionable {
                    action log-and-permit;
                }
                Enhanced_Nudity {
                    action log-and-permit;
                }
                Enhanced_Racism_and_Hate {
                    action log-and-permit;
                }
                Enhanced_Sex {
                    action log-and-permit;
                }
            }
            site-reputation-action {
                very-safe permit;
                moderately-safe permit;
                fairly-safe log-and-permit;
                suspicious quarantine;
                harmful block;
            }
            default permit;
            fallback-settings {
                default log-and-permit;
                server-connectivity block;
                timeout block;
                too-many-requests block;
            }
        }
    }
}

Next, we need configure a new UTM policy which includes the Enhanced Web Filtering feature. This can be combined with other UTM features such as Sophos anti-virus or content filtering.

[edit security utm]
root@NP-vSRX# set utm-policy UTM-DefaultInternetAccess web-filtering http-profile WF-DefaultInternetAccess

The last step is to attach the UTM profile to a security policy by configuring the application-services action.

[edit security policies from-zone internal-np to-zone internal-transit policy FW-Internal-PermitAll]
root@NP-vSRX# show
match {
    source-address any;
    destination-address any;
    application any;
}
then {
    permit {
        application-services {
            utm-policy UTM-DefaultInternetAccess;
        }
    }
}

Configuring logging

To make webfilter troubleshooting easier, configure the following syslog files, or alternatively send them to a syslog server.

[edit system syslog]
root@NP-vSRX# show
file blocked-sites {
    any any;
    match WEBFILTER_URL_BLOCKED;
}
file allowed-sites {
    any any;
    match WEBFILTER_URL_PERMITTED;
}

Testing

Testing the custom blacklist by browsing to sex.com – HTTPS session was broken (based on destination IP) and the browser returned an error.

Oct 13 14:21:14  NP-vSRX RT_UTM: WEBFILTER_URL_BLOCKED: WebFilter: ACTION="URL Blocked" 10.255.1.13(50278)->206.125.164.82(443) CATEGORY="EWF-Blacklist" REASON="BY_BLACK_LIST" PROFILE="WF-DefaultInternetAccess" URL=206.125.164.82 OBJ=/ username N/A roles N/A

Next, we test the URL in the whitelist (which was actually be blocked by Websense). Networking-forums loads fine now and we have this in the log:

Oct 13 14:23:43  NP-vSRX RT_UTM: WEBFILTER_URL_PERMITTED: WebFilter: ACTION="URL Permitted" 10.255.1.13(50303)->64.90.58.116(443) CATEGORY="EWF-Whitelist" REASON="BY_WHITE_LIST" PROFILE="WF-DefaultInternetAccess" URL=64.90.58.116 OBJ=/ username N/A roles N/A

As a last test, we initiate an HTTP session to http://www.penthouse.com
In the browser, we get the following message:

Juniper Networks Firewall has blocked the URL: 10.255.1.13(62175)->64.59.126.214(80) www.penthouse.com/ CATEGORY: Enhanced_Adult_Content REASON: BY_PRE_DEFINED

And in the syslog file, it looks like this:

Oct 13 14:33:29  NP-vSRX RT_UTM: WEBFILTER_URL_BLOCKED: WebFilter: ACTION="URL Blocked" 10.255.1.13(62175)->64.59.126.214(80) CATEGORY="Enhanced_Adult_Content" REASON="BY_PRE_DEFINED" PROFILE="WF-DefaultInternetAccess" URL=www.penthouse.com OBJ=/ username N/A roles N/A

Verification Commands

To check connectivity between your SRX and the Juniper Websense server:

root@NP-vSRX> show security utm web-filtering status
 UTM web-filtering status:
    Server status: Juniper Enhanced using Websense server UP

Web-filtering statistics – this is useful when the service is not working as expected.

root@NP-vSRX> show security utm web-filtering statistics
 UTM web-filtering statistics:
    Total requests:                     17086
    white list hit:                     20
    Black list hit:                     20
    No license permit:                  0
    Queries to server:                  6472
    Server reply permit:                1868
    Server reply block:                 9
    Server reply quarantine:            0
    Server reply quarantine block:      0
    Server reply quarantine permit:     0
    Custom category permit:             0
    Custom category block:              0
    Custom category quarantine:         0
    Custom category qurantine block:    0
    Custom category quarantine permit:  0
    Site reputation permit:             10597
    Site reputation block:              2495
    Site reputation quarantine:         49
    Site reputation quarantine block:   0
    Site reputation quarantine permit:  1170
    Site reputation by Category         0
    Site reputation by Global           14311
    Cache hit permit:                   847
    Cache hit block:                    11
    Cache hit quarantine:               0
    Cache hit quarantine block:         0
    Cache hit quarantine permit:        0
    Safe-search redirect:               0
    Web-filtering sessions in total:    128000
    Web-filtering sessions in use:      2
    Fallback:                       log-and-permit           block
          Default                                 0               0
          Timeout                                 0               0
     Connectivity                                 0               0
Too-many-requests                                 0               0

That’s pretty much all there is to it for a basic EWF setup. There are many more nerdknobs you can tune but I’ll stick to the basics for my JNCIP-SEC studies.

Bear in mind that the URL filter only works for HTTP traffic and most of the web these day is on SSL and using CDN networks, so it’s very hard to get a good match on SSL traffic. This can be solved by using SSL Forward Proxy or relying more on Layer-7 AppID with custom application signatures.

Sources:

Juniper Enhanced Web Filtering feature guide.

Route-based IPsec tunnels on the SRX

Expanding on the basic branch setup from my previous labs, I added another virtual SRX to the topology to exercise the VPN stuff. As the “ISP” router, I first tried adding a CSR-1000V to the lab but found out the hard way that it’s bandwidth throttled at 100kbps. With six virtual machines behind it sporadically fetching stuff off the internet, the entire lab came to a grinding halt. 🙂

As a quick workaround, I settled on a VyOS appliance , which was surprisingly easy to work with. It’s very similar to JunOS so I had it up and running in just a couple of minutes.

Anyway, enough about that. Here’s the network I’ll be working off to build some VPNs…

Topology

VPN Topology

Before you configure VPN tunnels, make sure that your public interface is listening for IKE traffic. This is defined on the zone or interface level.

[edit security zones security-zone untrust]
root@NP-vSRX-01# show
host-inbound-traffic {
    system-services {
        ssh;
        ping;
        ike;
    }
}
interfaces {
    ge-0/0/0.0;
}

Tunnel interface, routing and security zone

First, define a Secure Tunnel interface with IPv4 support by adding the inet family. If you forget the family inet statement, your tunnel will not pass traffic.

For simple tunnels without dynamic routing protocols, assigning an IP address is not required.

[edit interfaces]
root@NP-vSRX-01# show st0
unit 1 {
    description "Branch1 Tunnel Interface";
    family inet;
}

Create a static route for the peer subnet(s) and point it to the tunnel interface.

[edit]
root@NP-vSRX-01# set routing-options static route 10.2.0.0/24 next-hop st0.1

One thing I tend to forget is to add the st0 interface to the right security zone. Rather than putting it in the untrust zone, I will create a separate zone for VPN and put the tunnel there.

[edit security zones security-zone vpn]
root@NP-vSRX-01# show
interfaces {
    st0.1;
}

Once that is done, we can start configuring the actual VPN policy. There are a lot of components to configure, but once you know how they intertwine it’s pretty straightforward.

Configuring Phase 1

First, configure an IKE proposal. You could choose one of the JunOS templates, but where’s the fun in that, right? 🙂

[edit security ike]
root@NP-vSRX-01# show
proposal P1-Proposal-Branch1 {
    description "Branch1 Phase1 Proposal";
    authentication-method pre-shared-keys;
    authentication-algorithm sha-256;
    encryption-algorithm aes-256-cbc;
    lifetime-seconds 43200;
}

Once we have the P1 proposal, we define the phase 1 policy which in turn refers to the proposal. Unless your peer has a dynamic IP, main mode is what you need. This is also where you specify the preshared key.

[edit security ike policy P1-Policy-Branch1]
root@NP-vSRX-01# show
mode main;
description "Branch1 Phase1 Policy";
proposals P1-Proposal-Branch1;
pre-shared-key ascii-text "$9$DDH.f9CuB1hqMORhcle4aZGjq"; ## SECRET-DATA

Third and last for Phase 1 template, configure the gateway peer IP address with the corresponding policy. If possible, always use IKE version 2. The external interface is where the SRX can expect the UDP/500 packets.

[edit security ike gateway P1-Peer-Branch1]
root@NP-vSRX-01# show
ike-policy P1-Policy-Branch1;
address 2.2.2.1;
external-interface ge-0/0/0;
version v2-only;

Now that Phase1 is set, we can move on to the IPsec configuration.

Phase 2 – IPsec

Just as we did before, we first define a proposal. Choose your most secure option for encryption and hashing, and a reasonably short keying lifetime.

[edit security ipsec proposal P2-Proposal-Branch1]
root@NP-vSRX-01# show
description "Branch1 Phase2 Proposal";
protocol esp;
authentication-algorithm hmac-sha-256-128;
encryption-algorithm aes-256-cbc;
lifetime-seconds 3600;

Configure the IPsec policy that again refers to the proposal. Unless the peer does not support it, always turn on PFS.

[edit security ipsec policy P2-Policy-Branch1]
root@NP-vSRX-01# show
description "Branch1 Phase2 Policy";
perfect-forward-secrecy {
    keys group5;
}
proposals P2-Proposal-Branch1;

The final step is where the Phase 1 and 2 components are glued together. For route-based tunnels, don’t forget to bind your st interface. I prefer to negotiate the tunnels immediately rather than waiting for traffic.

[edit security ipsec vpn P2-IPsec-Branch1]
root@NP-vSRX-01# show
bind-interface st0.1;
ike {
    gateway P1-Peer-Branch1;
    ipsec-policy P2-Policy-Branch1;
}
establish-tunnels immediately;

Security Policies

From a VPN point of view, we are ready to accept IPsec connections on this box. We are listening for IKE traffic, we have a route pointing to our tunnel interface and VPN policies are configured. The only thing we need to do is configure the firewall policies.

For this one, I will be allowing traffic from the remote sites to one of the machines on the trust zone. I already created some objects in the global address book.

From VPN to Trust:

[edit security policies from-zone vpn to-zone trust]
root@NP-vSRX-01# show
policy FW-Allow-VPN-Branch {
    match {
        source-address Host-10.2.0.10;
        destination-address Host-10.0.0.10;
        application any;
    }
    then {
        permit;
        count;
    }
}

From Trust to VPN:

[edit security policies]
root@NP-vSRX-01# show from-zone trust to-zone vpn
policy FW-Allow-VPN-Branch {
    match {
        source-address Host-10.0.0.10;
        destination-address Host-10.2.0.10;
        application any;
    }
    then {
        permit;
        count;
    }
}

Configuring the Branch site SRX

The benefit of having two SRX’s is that you can easily copy-paste, edit and mirror the config.

### PHASE 1 ### 

set security ike proposal P1-Proposal-HQ description "HQ Phase1 Proposal"
set security ike proposal P1-Proposal-HQ authentication-method pre-shared-keys
set security ike proposal P1-Proposal-HQ authentication-algorithm sha-256
set security ike proposal P1-Proposal-HQ encryption-algorithm aes-256-cbc
set security ike proposal P1-Proposal-HQ lifetime-seconds 43200
set security ike policy P1-Policy-HQ mode main
set security ike policy P1-Policy-HQ description "HQ Phase1 Policy"
set security ike policy P1-Policy-HQ proposals P1-Proposal-HQ
set security ike policy P1-Policy-HQ pre-shared-key ascii-text "$9$DDH.f9CuB1hqmORhcle4aZGjq"
set security ike gateway P1-Peer-HQ ike-policy P1-Policy-HQ
set security ike gateway P1-Peer-HQ address 1.1.1.1
set security ike gateway P1-Peer-HQ external-interface ge-0/0/0

### PHASE 2 ####

set security ipsec proposal P2-Proposal-HQ description "HQ Phase2 Proposal"
set security ipsec proposal P2-Proposal-HQ protocol esp
set security ipsec proposal P2-Proposal-HQ authentication-algorithm hmac-sha-256-128
set security ipsec proposal P2-Proposal-HQ encryption-algorithm aes-256-cbc
set security ipsec proposal P2-Proposal-HQ lifetime-seconds 3600
set security ipsec policy P2-Policy-HQ description "HQ Phase2 Policy"
set security ipsec policy P2-Policy-HQ perfect-forward-secrecy keys group5
set security ipsec policy P2-Policy-HQ proposals P2-Proposal-HQ
set security ipsec vpn P2-IPsec-HQ bind-interface st0.1
set security ipsec vpn P2-IPsec-HQ ike gateway P1-Peer-HQ
set security ipsec vpn P2-IPsec-HQ ike ipsec-policy P2-Policy-HQ

#### TUNNEL INTERFACE ### 

set interfaces st0 unit 1 description "HQ Tunnel Interface"
set interfaces st0 unit 1 family inet

### HOST INBOUND TRAFFIC ### 

set security zones security-zone untrust host-inbound-traffic system-services ike

### ADD TUNNEL TO ZONE ###

set security zones security-zone untrust interfaces st0.1

### ADD ROUTE ###

set routing-options static route 10.0.0.0/24 next-hop st0.1
set routing-options static route 10.0.4.0/24 next-hop st0.1

### SECURITY POLICIES ### 

set security policies from-zone vpn to-zone branch policy FW-Allow-VPN-HQ-In match source-address Host-10.0.0.10
set security policies from-zone vpn to-zone branch policy FW-Allow-VPN-HQ-In match destination-address Host-10.2.0.10
set security policies from-zone vpn to-zone branch policy FW-Allow-VPN-HQ-In match application any
set security policies from-zone vpn to-zone branch policy FW-Allow-VPN-HQ-In then permit
set security policies from-zone vpn to-zone branch policy FW-Allow-VPN-HQ-In then count
set security policies from-zone branch to-zone vpn policy FW-Allow-VPN-HQ-Server match source-address Host-10.2.0.10
set security policies from-zone branch to-zone vpn policy FW-Allow-VPN-HQ-Server match destination-address Host-10.0.0.10
set security policies from-zone branch to-zone vpn policy FW-Allow-VPN-HQ-Server match application any
set security policies from-zone branch to-zone vpn policy FW-Allow-VPN-HQ-Server then permit
set security policies from-zone branch to-zone vpn policy FW-Allow-VPN-HQ-Server then count

Verification

On the HQ SRX, we already have a phase 1 tunnel up using IKEv2 as the exchange protocol.

root@NP-vSRX-01> show security ike security-associations
Index   State  Initiator cookie  Responder cookie  Mode           Remote Address
2441630 UP     2fb27eba88550b6b  e8b7c6a94c94f8d2  IKEv2          2.2.2.1

We also have a Phase 2 tunnel, with just under one hour of lifetime left.

root@NP-vSRX-01> show security ipsec security-associations
  Total active tunnels: 1
  ID    Algorithm       SPI      Life:sec/kb  Mon lsys Port  Gateway
  <131073 ESP:aes-cbc-256/sha256 14b32bcb 3433/ unlim - root 500 2.2.2.1
  >131073 ESP:aes-cbc-256/sha256 fef69f20 3433/ unlim - root 500 2.2.2.1

Some more details about the IPsec parameters, like Proxy IDs (0.0.0.0/0) and encryption/authentication standards.

root@NP-vSRX-01> show security ipsec security-associations index 131073 detail
  ID: 131073 Virtual-system: root, VPN Name: P2-IPsec-Branch1
  Local Gateway: 1.1.1.1, Remote Gateway: 2.2.2.1
  Local Identity: ipv4_subnet(any:0,[0..7]=0.0.0.0/0)
  Remote Identity: ipv4_subnet(any:0,[0..7]=0.0.0.0/0)
  Version: IKEv2
    DF-bit: clear
    Bind-interface: st0.1

  Port: 500, Nego#: 32, Fail#: 0, Def-Del#: 0 Flag: 0x600a29
  Last Tunnel Down Reason: Delete payload received
    Direction: inbound, SPI: 14b32bcb, AUX-SPI: 0
                              , VPN Monitoring: -
    Hard lifetime: Expires in 3339 seconds
    Lifesize Remaining:  Unlimited
    Soft lifetime: Expires in 2752 seconds
    Mode: Tunnel(0 0), Type: dynamic, State: installed
    Protocol: ESP, Authentication: hmac-sha256-128, Encryption: aes-cbc (256 bits)
    Anti-replay service: counter-based enabled, Replay window size: 64

    Direction: outbound, SPI: fef69f20, AUX-SPI: 0
                              , VPN Monitoring: -
    Hard lifetime: Expires in 3339 seconds
    Lifesize Remaining:  Unlimited
    Soft lifetime: Expires in 2752 seconds
    Mode: Tunnel(0 0), Type: dynamic, State: installed
    Protocol: ESP, Authentication: hmac-sha256-128, Encryption: aes-cbc (256 bits)
    Anti-replay service: counter-based enabled, Replay window size: 64

A good way to verify that there’s two-way communication is to inspect the IPsec counters

root@NP-vSRX-01> show security ipsec statistics index 131073
ESP Statistics:
  Encrypted bytes:        140965904
  Decrypted bytes:       3342178434
  Encrypted packets:        1132200
  Decrypted packets:        2245688
AH Statistics:
  Input bytes:                    0
  Output bytes:                   0
  Input packets:                  0
  Output packets:                 0
Errors:
  AH authentication failures: 0, Replay errors: 251
  ESP authentication failures: 0, ESP decryption failures: 0
  Bad headers: 0, Bad trailers: 0

The ultimate test is to verify on the internal machines. Note the asterisks on the tunnel segment. If there’s an address assigned to the st interface, this one would show in the trace results.

root@Branch-vSRX-01> ssh lab@10.2.0.10
lab@10.2.0.10's password:
Welcome to Ubuntu 14.10 (GNU/Linux 3.16.0-23-generic x86_64)

 * Documentation:  https://help.ubuntu.com/

Last login: Thu Sep 10 22:27:33 2015
lab@V120-10:~$ ping 10.0.0.10
PING 10.0.0.10 (10.0.0.10) 56(84) bytes of data.
64 bytes from 10.0.0.10: icmp_seq=1 ttl=62 time=10.3 ms
64 bytes from 10.0.0.10: icmp_seq=2 ttl=62 time=13.5 ms
64 bytes from 10.0.0.10: icmp_seq=3 ttl=62 time=11.6 ms
^C
--- 10.0.0.10 ping statistics ---
3 packets transmitted, 3 received, 0% packet loss, time 2003ms
rtt min/avg/max/mdev = 10.370/11.869/13.567/1.318 ms

lab@V120-10:~$ traceroute 10.0.0.10
traceroute to 10.0.0.10 (10.0.0.10), 30 hops max, 60 byte packets
 1  10.2.0.1 (10.2.0.1)  3.864 ms  3.912 ms  4.003 ms
 2  * * *
 3  10.0.0.10 (10.0.0.10)  13.682 ms  13.679 ms  13.666 ms
lab@V120-10:~$

That’s it, a fully functional, although very basic, route-based VPN.

SRX Screen Options – Part 3

Last post in this series about Juniper Screen Options. Again, I will be working on the topology below.

SRX Screen Options Topology

OS Attacks: Ping of Death, Teardrop & WinNuke

These three are pretty old attacks, so unless you are still running some legacy system, you shouldn’t be worried about them. Anyway, here goes:

  • Ping of death – This is a rather old attack in which packets were sent with a size exceeding the maximum IP datagram size of 65.535 bytes, including the headers. When reassembled, some operating systems experienced a buffer overflow, causing all sorts of unwanted behaviour. Read all about it here
  • Teardrop attack – triggered by sending IP fragments with overlapping data to a remote host. When reassembling, some OS’s would crash. More information here…
  • WinNuke – This is a one-packet-kill attack, which was performed by sending a NetBIOS packet with Out-of-Band data. Windows 95 could not handle this and would possibly BSOD. Used in abundance on IRC in the days 🙂 More info here

Enabling these screens is just a matter of turning on the switch:

[edit security screen ids-option Attack-Screen]
root@NP-vSRX-01# set tcp winnuke

[edit security screen ids-option Attack-Screen]
root@NP-vSRX-01# set ip tear-drop

[edit security screen ids-option Attack-Screen]
root@NP-vSRX-01# set icmp ping-death

By enabling it, JunOS will look for the typical attack signatures in the packets and when detected, filter it. It’s not a bad idea to leave it enabled. Who knows, you might find someone still trying the WinNuke attack against your Windows 2012 servers 🙂

I don’t have any prehistoric OS’es lying around so I can’t test these ones.

unknown-protocol – Blocking packets with invalid protocol numbers

Although your security policy will probably be allowing only TCP, UDP and perhaps some traffic related to VPNs or routing protocols, this screen will check the packets for invalid (non-assigned) IP protocols before they enter the traffic flow. IANA has a list with all the protocol number assignments. Any protocol number not on the list should be dropped by JunOS. Wonder if Juniper keeps the software updated when new numbers are allocated.

Enabling the screen is again straight-forward:

[edit security screen ids-option Attack-Screen]
root@NP-vSRX-01# set ip bad-option

syn-frag – Fragmented SYN packets

SYN packets are always very minimal in size, so it’s abnormal to have a SYN packet with the Fragment bit set. Junos will block this type of packet upon arrival on the interface.

[edit security screen ids-option Attack-Screen]
root@NP-vSRX-01# set tcp syn-frag

By configuring nping to set the SYN-flag and the More Fragments bit we can craft a syn-frag packet

lab@Host200:~$ sudo nping --tcp --flags SYN 10.0.100.100 -p 21 --mf

Starting Nping 0.6.46 ( http://nmap.org/nping ) at 2015-08-16 20:36 CEST
SENT (0.0025s) TCP 10.0.200.200:15585 > 10.0.100.100:21 S ttl=64 id=52614 iplen=40 frag offset=0+  seq=3992461002 win=1480
SENT (1.0027s) TCP 10.0.200.200:15585 > 10.0.100.100:21 S ttl=64 id=52614 iplen=40 frag offset=0+  seq=3992461002 win=1480
SENT (2.0040s) TCP 10.0.200.200:15585 > 10.0.100.100:21 S ttl=64 id=52614 iplen=40 frag offset=0+  seq=3992461002 win=1480
SENT (3.0053s) TCP 10.0.200.200:15585 > 10.0.100.100:21 S ttl=64 id=52614 iplen=40 frag offset=0+  seq=3992461002 win=1480
SENT (4.0066s) TCP 10.0.200.200:15585 > 10.0.100.100:21 S ttl=64 id=52614 iplen=40 frag offset=0+  seq=3992461002 win=1480

Max rtt: N/A | Min rtt: N/A | Avg rtt: N/A
Raw packets sent: 5 (200B) | Rcvd: 0 (0B) | Lost: 5 (100.00%)
Nping done: 1 IP address pinged in 5.01 seconds

And again, the SRX performed as expected:

2015-08-16 18:31:22 UTC  SYN fragment! source: 10.0.200.200:53479, destination: 10.0.100.100:21, zone name: attacker, interface name: ge-0/0/2.0, action: drop

Configuring the aggressive session ageout option

Another way to keep your firewalls session table from getting clogged is to configure an aggressive session timeout, also known as early aging. This will cause the SRX to age out idle sessions significantly faster than the default values (e.g. 30 minutes for TCP). All you need to do is define a low and high watermark, which is a percentage of the total sessions your box can handle, and a new “aggressive” age-out timer.

You can find out how much your SRX supports by entering the show security monitoring fpc 0 command (more FPCs are possible depending on model) and observing the Max flow session field. For example, the vSRX supports a total of 262144 sessions.

root@NP-vSRX-01> show security monitoring fpc 0
FPC 0
  PIC 0
    CPU utilization          :    0 %
    Memory utilization       :   63 %
    Current flow session     :    3
    Current flow session IPv4:    3
    Current flow session IPv6:    0
    Max flow session         : 262144
Total Session Creation Per Second (for last 96 seconds on average):    0
IPv4  Session Creation Per Second (for last 96 seconds on average):    0
IPv6  Session Creation Per Second (for last 96 seconds on average):    0

There are three values to consider when configuring the feature:

high-watermark – This is the percentage of total session capacity that should be reached before the mechanism kicks in. Suppose that we define a high watermark of 75 percent on this vSRX, then it will start applying the aggressive timer once it reaches 196608 (=262144*0.75) sessions.

low-watermark – The percentage of session capacity it should reach to disable aggressive aging and go back to the default session timeout.

early-ageout – Agressive timeout period, in seconds.

Suppose that we want the vSRX to start agressively shutting down sessions that have been idle for more than 30 seconds once it is at 75 percent of its capacity, and resume normal operations when it hits 50 percent again, we would go to the security flow branch and configure the following:

[edit security flow]
root@NP-vSRX-01# show
aging {
    early-ageout 30;
    low-watermark 50;
    high-watermark 75;
}

Monitoring Screen Options

A couple of commands that will help monitor the alarms and configuration

show configuration security screen – Shows the syntax in the config file

root@NP-vSRX-01> show configuration security screen
ids-option Attack-Screen {
    description "Screen Attacker Zone";
    icmp {
        ip-sweep;
    }
    ip {
        bad-option;
        record-route-option;
        timestamp-option;
        security-option;
        stream-option;
        spoofing;
        source-route-option;
        loose-source-route-option;
        strict-source-route-option;
    }
    tcp {
        syn-fin;
        fin-no-ack;
        tcp-no-flag;
        syn-frag;
        port-scan threshold 3000;
        syn-ack-ack-proxy threshold 4;
        land;
    }
}

show security screen ids-option [screen-name] – shows the enabled screens in a more readable format

root@NP-vSRX-01> show security screen ids-option Attack-Screen
Description: Screen Attacker Zone
Screen object status:

Name                                         Value
  TCP port scan threshold                    3000
  ICMP address sweep threshold               5000
  IP spoofing                                enabled
  IP source route option                     enabled
  TCP land attack                            enabled
  TCP SYN fragment                           enabled
  TCP no flag                                enabled
  IP bad options                             enabled
  IP record route option                     enabled
  IP timestamp option                        enabled
  IP security option                         enabled
  IP loose source route option               enabled
  IP strict source route option              enabled
  IP stream option                           enabled
  TCP SYN FIN                                enabled
  TCP FIN no ACK                             enabled
  TCP SYN-ACK-ACK proxy threshold            4

show security zones [zone-name] – Shows you which screen is applied to a particular zone

root@NP-vSRX-01> show security zones attacker

Security zone: attacker
  Send reset for non-SYN session TCP packets: Off
  Policy configurable: Yes
  Screen: Attack-Screen
  Interfaces bound: 1
  Interfaces:
    ge-0/0/2.0

show security screen statistics zone [zone-name] – shows you the hitcount for all the screens.

root@NP-vSRX-01> show security screen statistics zone attacker
Screen statistics:

IDS attack type                              Statistics
  ICMP flood                                 0
  UDP flood                                  0
  TCP winnuke                                0
  TCP port scan                              47
  UDP port scan                              0
  ICMP address sweep                         0
  TCP sweep                                  0
  UDP sweep                                  0
  IP tear drop                               0
  TCP SYN flood                              0
  IP spoofing                                0
  ICMP ping of death                         0
  IP source route option                     0
  TCP land attack                            0
  TCP SYN fragment                           13
  TCP no flag                                791118
  IP unknown protocol                        0
  IP bad options                             0
  IP record route option                     0
  IP timestamp option                        0
  IP security option                         0
  IP loose source route option               0
  IP strict source route option              0
  IP stream option                           0
  ICMP fragment                              0
  ICMP large packet                          0
  TCP SYN FIN                                20
  TCP FIN no ACK                             20
  Source session limit                       0
  TCP SYN-ACK-ACK proxy                      0
  IP block fragment                          0
  Destination session limit                  0
  IPv6 extension header                      0
  IPv6 extension hop by hop option           0
  IPv6 extension destination option          0
  IPv6 extension header limit                0
  IPv6 malformed header                      0
  ICMPv6 malformed packet                    0

show security log – Shows you the syslog events with a bit more detail. Best to send this to a syslog server for retention…

2015-08-16 18:45:31 UTC  No TCP flag! source: 10.0.200.200:58501, destination: 10.0.100.100:0, zone name: attacker, interface name: ge-0/0/2.0, action: drop
2015-08-16 18:45:31 UTC  No TCP flag! source: 10.0.200.200:58502, destination: 10.0.100.100:0, zone name: attacker, interface name: ge-0/0/2.0, action: drop
2015-08-16 18:45:31 UTC  No TCP flag! source: 10.0.200.200:58503, destination: 10.0.100.100:0, zone name: attacker, interface name: ge-0/0/2.0, action: drop
2015-08-16 18:45:31 UTC  No TCP flag! source: 10.0.200.200:58504, destination: 10.0.100.100:0, zone name: attacker, interface name: ge-0/0/2.0, action: drop
2015-08-16 18:45:31 UTC  No TCP flag! source: 10.0.200.200:58505, destination: 10.0.100.100:0, zone name: attacker, interface name: ge-0/0/2.0, action: drop
2015-08-16 18:45:31 UTC  No TCP flag! source: 10.0.200.200:7343, destination: 10.0.100.100:0, zone name: attacker, interface name: ge-0/0/2.0, action: drop
2015-08-16 18:45:31 UTC  No TCP flag! source: 10.0.200.200:7344, destination: 10.0.100.100:0, zone name: attacker, interface name: ge-0/0/2.0, action: drop
2015-08-16 18:45:31 UTC  No TCP flag! source: 10.0.200.200:7345, destination: 10.0.100.100:0, zone name: attacker, interface name: ge-0/0/2.0, action: drop
2015-08-16 18:45:31 UTC  No TCP flag! source: 10.0.200.200:7346, destination: 10.0.100.100:0, zone name: attacker, interface name: ge-0/0/2.0, action: drop
2015-08-16 18:45:31 UTC  No TCP flag! source: 10.0.200.200:7347, destination: 10.0.100.100:0, zone name: attacker, interface name: ge-0/0/2.0, action: drop
2015-08-16 18:45:31 UTC  No TCP flag! source: 10.0.200.200:7348, destination: 10.0.100.100:0, zone name: attacker, interface name: ge-0/0/2.0, action: drop
2015-08-16 18:45:31 UTC  No TCP flag! source: 10.0.200.200:7349, destination: 10.0.100.100:0, zone name: attacker, interface name: ge-0/0/2.0, action: drop
2015-08-16 18:45:31 UTC  No TCP flag! source: 10.0.200.200:7350, destination: 10.0.100.100:0, zone name: attacker, interface name: ge-0/0/2.0, action: drop
2015-08-16 18:45:31 UTC  No TCP flag! source: 10.0.200.200:7351, destination: 10.0.100.100:0, zone name: attacker, interface name: ge-0/0/2.0, action: drop
2015-08-16 18:45:31 UTC  No TCP flag! source: 10.0.200.200:7352, destination: 10.0.100.100:0, zone name: attacker, interface name: ge-0/0/2.0, action: drop
2015-08-16 18:45:31 UTC  No TCP flag! source: 10.0.200.200:7353, destination: 10.0.100.100:0, zone name: attacker, interface name: ge-0/0/2.0, action: drop

Wrapping up

This was my last post on the Screen Options. I have omitted a few from the JNCIS-SEC study guide, either because I see little use for them in production or because there’s little to do in the lab besides turning it on.

Frankly, I never bothered with Screen Options because I wasn’t all familiar with them but I really see the benefits of having many of them enabled.

Anyway, if you’ve made it through the posts, thanks for reading and feel free to add a comment. Next labs, all about NAT 🙂

SRX Screen Options – Part 2

In my previous post I already went into a couple of screens, mainly ones that detect or block network reconnaissance tactics, such as Ping Sweeps, Port Scans and OS detection. This article will focus more on the DoS and DDoS attacks itself, like SYN and session floods.

The network topology will remain the same as last time, with one host on the dmz network and an attacker on the outside, where the Screen is positioned.

SRX Screen Options Topology

ip-spoofing – Unicast Reverse Path Forwarding check

Similar to how the RPF mechanism on routers and other L3 devices works, the IP-Spoofing Screen compares the source address of the incoming packet against the longest matched prefix in the forwarding-table. If the best route found is pointing to an interface other than the one on which the packet was received, the OS decides it must be a spoofed packet and drops it.

We already have a Screen profile configured from the previous post, so I will just be adding the ip-spoofing option:

[edit security screen ids-option Attack-Screen]
root@NP-vSRX-01# set ip spoofing

[edit security screen ids-option Attack-Screen]
root@NP-vSRX-01# show | compare
[edit security screen ids-option Attack-Screen ip]
+  spoofing;

To spoof the packets’ source IP, I will be using NPING, which gives you granular control of all the fields and options in the L3 and L4 protocol headers.

I will be sending 5 packets, destined for the server’s IP address on port 80, with a spoofed IP address of 10.0.100.50.

lab@Host200:~$ sudo nping --tcp -p 80 -S 10.0.100.50 10.0.100.100

Starting Nping 0.6.46 ( http://nmap.org/nping ) at 2015-07-28 23:10 CEST
SENT (0.0028s) TCP 10.0.100.50:49704 > 10.0.100.100:80 S ttl=64 id=13538 iplen=40  seq=3917867081 win=1480
SENT (1.0032s) TCP 10.0.100.50:49704 > 10.0.100.100:80 S ttl=64 id=13538 iplen=40  seq=3917867081 win=1480
SENT (2.0046s) TCP 10.0.100.50:49704 > 10.0.100.100:80 S ttl=64 id=13538 iplen=40  seq=3917867081 win=1480
SENT (3.0060s) TCP 10.0.100.50:49704 > 10.0.100.100:80 S ttl=64 id=13538 iplen=40  seq=3917867081 win=1480
SENT (4.0073s) TCP 10.0.100.50:49704 > 10.0.100.100:80 S ttl=64 id=13538 iplen=40  seq=3917867081 win=1480

Max rtt: N/A | Min rtt: N/A | Avg rtt: N/A
Raw packets sent: 5 (200B) | Rcvd: 0 (0B) | Lost: 5 (100.00%)
Nping done: 1 IP address pinged in 5.01 seconds

The source IP obviously belongs to the same subnet as the destination so if the ip-spoofing Screen works as advertised, we should see it in the logs:

2015-07-28 21:06:30 UTC  IP spoofing! source: 10.0.100.50, destination: 10.0.100.100, protocol-id: 6, zone name: attacker, interface name: ge-0/0/2.0, action: drop
2015-07-28 21:06:31 UTC  IP spoofing! source: 10.0.100.50, destination: 10.0.100.100, protocol-id: 6, zone name: attacker, interface name: ge-0/0/2.0, action: drop
2015-07-28 21:06:32 UTC  IP spoofing! source: 10.0.100.50, destination: 10.0.100.100, protocol-id: 6, zone name: attacker, interface name: ge-0/0/2.0, action: drop
2015-07-28 21:06:33 UTC  IP spoofing! source: 10.0.100.50, destination: 10.0.100.100, protocol-id: 6, zone name: attacker, interface name: ge-0/0/2.0, action: drop
2015-07-28 21:06:34 UTC  IP spoofing! source: 10.0.100.50, destination: 10.0.100.100, protocol-id: 6, zone name: attacker, interface name: ge-0/0/2.0, action: drop

The packets were dropped -which is good- but unfortunately, the log doesn’t mention any source or destination ports in the logs. If somebody was trying to send spoofed packets to my server, it would be great to know which port they were targeting.

Sidenote – the SRX also has a second way of configuring this, being the standard rpf-check, which is covered in the JNCIA curriculum. This one is easier though.

session-limt – Limiting sessions by Source or Destination IP

This Screen can put a cap on the maximum number of connections any given source or destination IP can create. Any subsequent connections will be dropped. This is a very basic setting, and it does require you to establish a baseline for the amount of connections you expect on any given server. If you are unsure at first, you can configure the alarm-without-drop setting to create a baseline first.

For this example, suppose that we are a small shop running an FTP service and we never expect more than 64 simultaneous connections to our server. I will configure a destination-limit of 64 connections and a source-limit of 16 to protect it against flooding by a single remote host.

[edit security screen ids-option Attack-Screen]
root@NP-vSRX-01# set limit-session destination-ip-based 64 source-ip-based 16

Flooding the server with connection attempts, 1000 packets per second.

lab@Host200:~$ sudo nping 10.0.100.100 --tcp-connect -rate=1000 -c 5000 -q $1 -p 21

Starting Nping 0.6.46 ( http://nmap.org/nping ) at 2015-08-11 23:10 CEST
Max rtt: 1.956ms | Min rtt: 0.108ms | Avg rtt: 0.950ms
TCP connection attempts: 5000 | Successful connections: 16 | Failed: 4984 (99.68%)
Nping done: 1 IP address pinged in 9.17 seconds

As configured on the screen, the remote host only received 16 responses from the FTP server. Again, this logging is pretty basic – no destination IP or port numbers mentioned…

2015-08-11 21:33:50 UTC  Src IP session limit! source: 10.0.200.200, zone name: attacker, interface name: ge-0/0/2.0, action: drop

By using randomized source IP addresses (with hping3) I was also able to trigger the destination-limit.

2015-08-11 21:27:04 UTC  Dst IP session limit! destination: 10.0.100.100, zone name: attacker, interface name: ge-0/0/2.0, action: drop

It’s pretty basic, but it does protect your device from getting flooded by remote hosts. While testing without the screen, it wasn’t that difficult to DoS my virtual machines’ FTP, SSH and Telnet daemons when flooding connections (at 1 Gbps 🙂 )

syn-ack-ack – Handshake proxying

Similar to the session-limit, the SYN-ACK-ACK screen will limit the number of concurrent sessions any untrusted host can establish. This time, the SRX will serve as the middle-man between the source and destination hosts. First, the SRX will check the session table and, if a new session needs to be initiated, perform the three-way handshake with the initiator. Once the handshake between the remote host and SRX is complete, the SRX will proxy the three-way handshake to the server, after which the original source and destination can communicate.

The SRX keeps track of all the sessions it has established and will, once the syn-ack-ack proxy treshold for a particular source IP has been reached, reject any further connection attempts.

Defining a threshold of 512 sesssions:

[edit security screen ids-option Attack-Screen]
root@NP-vSRX-01# set tcp syn-ack-ack-proxy threshold 512

Again, it would be best to make a good baseline of expected traffic patterns before implementing this…

syn-flood – embryonic session floods

Probably the most commmon Layer4 attack is the SYN flood, in which your boxes get flooded with SYN packets from seemingly thousands of hosts. Although it is quite possible that you’re being pwned by a botnet, it’s more likely that the packets are being spoofed with random source IPs. The server will then create a half-open socket, reply to the bogus IP with a SYN-ACK and wait for a response that will never come. Obviously, at thousand and thousands of packets per second, this can fill up the session table quite rapidly and kill your server.

By enabling this screen, the SRX will monitor and police the number of SYN packets passing through the device. There are five parameters to consider for the syn-flood screen:

  • Attack Threshold – the total number of SYN packets per second that can be received before the SRX starts proxying SYN packets, taking the burden off the servers shoulders
  • Alarm Threshold – how many embryonic sessions can be created before a syslog event is logged
  • Source Threshold – the total number of SYN packets that can be received from any given source IP
  • Destination Threshold – the number of SYN packets that can be received destined for a particular destination IP (your server)
  • Timeout – how long the SRX should wait before killing of a half-open session

Let’s illustrate with an example. At 100 SYN packets, the SRX will go into proxying mode. When 50 more packets are received within a second, an alarm will be logged. The threshold per source IP is 50 pps. Half-open sessions will time out after 10 seconds.

[edit security screen ids-option Attack-Screen tcp syn-flood]
root@NP-vSRX-01# show
alarm-threshold 150;
attack-threshold 100;
source-threshold 50;
timeout 10;

Flooding port 21 with hping3:

lab@Host200:~$ sudo hping3 -S --flood -V $1 10.0.100.100 -p 21
using eth0, addr: 10.0.200.200, MTU: 1500
HPING 10.0.100.100 (eth0 10.0.100.100): S set, 40 headers + 0 data bytes
hping in flood mode, no replies will be shown
^C
--- 10.0.100.100 hping statistic ---
4735022 packets transmitted, 0 packets received, 100% packet loss
round-trip min/avg/max = 0.0/0.0/0.0 ms

The SRX security log:

2015-08-14 20:33:19 UTC  SYN flood Src-IP based! source: 10.0.200.200:1106, destination: 10.0.100.100:21, zone name: attacker, interface name: ge-0/0/2.0, action: drop
2015-08-14 20:33:19 UTC  SYN flood Src-IP based! source: 10.0.200.200:1107, destination: 10.0.100.100:21, zone name: attacker, interface name: ge-0/0/2.0, action: drop
2015-08-14 20:33:19 UTC  SYN flood Src-IP based! source: 10.0.200.200:1108, destination: 10.0.100.100:21, zone name: attacker, interface name: ge-0/0/2.0, action: drop
2015-08-14 20:33:19 UTC  SYN flood! destination: 10.0.100.100, zone name: attacker, interface name: ge-0/0/2.0, action: alarm-without-drop
2015-08-14 20:33:20 UTC  SYN flood! destination: 10.0.100.100, zone name: attacker, interface name: ge-0/0/2.0, action: alarm-without-drop
2015-08-14 20:33:21 UTC  SYN flood! destination: 10.0.100.100, zone name: attacker, interface name: ge-0/0/2.0, action: alarm-without-drop

Another good example can be found on the Juniper site.

Enabling SYN Cookies

With the SYN cookie feature, the SRX will take some attributes of the original SYN packet and run it through a mathematical formula, resulting in a hashed number. This number will be used as the Initial Sequence number in the returned SYN-ACK packet. When the final ACK packet is received, it is validated against the “challenge” that was sent in the initial response.

You can read all about SYN Cookies here and here.

Enabling it is not done at the ids-options, but at the flow options:

[edit security flow]
root@NP-vSRX-01# set syn-flood-protection-mode syn-cookie

Dropping TCP LAND attacks

By sending a specially crafted TCP packet to a server, which contains the same IP as destination in the source field it is possible to exhaust the session table. The server would then send the responses to itself and create half-open sessions. This is called a Local Area Network Denial attack. Seems like recent operating systems are no longer vulnerable but then again, not everyone is running recent operating systems 🙂

Enabling it – I also disabled the RPF check just to be sure it will be hit:

[edit security screen ids-option Attack-Screen]
root@NP-vSRX-01# set tcp land

I first tried triggering this with just a couple of packets crafted in nping, but it was not triggering the Screen. Seems like the LAND screen doesn’t filter every packet, but instead only triggers when being flooded…

lab@Host200:~$ sudo hping3 -S --flood -V $1 10.0.100.100 -p 21 -a 10.0.100.100
using eth0, addr: 10.0.200.200, MTU: 1500
HPING 10.0.100.100 (eth0 10.0.100.100): S set, 40 headers + 0 data bytes
hping in flood mode, no replies will be shown
^C
--- 10.0.100.100 hping statistic ---
4561685 packets transmitted, 0 packets received, 100% packet loss
round-trip min/avg/max = 0.0/0.0/0.0 ms

This time, the LAND attack was logged on the SRX:

2015-08-14 21:09:59 UTC  Land attack! source: 10.0.100.100:21, destination: 10.0.100.100:21, zone name: attacker, interface name: ge-0/0/2.0, action: drop
2015-08-14 21:10:00 UTC  Land attack! source: 10.0.100.100:21, destination: 10.0.100.100:21, zone name: attacker, interface name: ge-0/0/2.0, action: drop
2015-08-14 21:10:01 UTC  Land attack! source: 10.0.100.100:21, destination: 10.0.100.100:21, zone name: attacker, interface name: ge-0/0/2.0, action: drop
2015-08-14 21:10:02 UTC  Land attack! source: 10.0.100.100:21, destination: 10.0.100.100:21, zone name: attacker, interface name: ge-0/0/2.0, action: drop

However, it didn’t stop all packets. This was rushing across the screen on the end node, using tcpdump:

23:14:01.539414 IP 10.0.100.100.21 > 10.0.100.100.4271: Flags [S.], seq 1210268274, ack 1980846482, win 0, length 0
23:14:01.539415 IP 10.0.100.100.21 > 10.0.100.100.4272: Flags [S.], seq 1893206533, ack 1324671463, win 0, length 0
23:14:01.539416 IP 10.0.100.100.21 > 10.0.100.100.4273: Flags [S.], seq 1640167563, ack 1602524016, win 0, length 0
23:14:01.539641 IP 10.0.100.100.21 > 10.0.100.100.4274: Flags [S.], seq 1406775185, ack 1845052534, win 0, length 0
23:14:01.539643 IP 10.0.100.100.21 > 10.0.100.100.4275: Flags [S.], seq 339434124, ack 711012714, win 0, length 0
23:14:01.539644 IP 10.0.100.100.21 > 10.0.100.100.4276: Flags [S.], seq 1167828292, ack 2077183650, win 0, length 0
23:14:01.539645 IP 10.0.100.100.21 > 10.0.100.100.4277: Flags [S.], seq 275256947, ack 780565910, win 0, length 0
23:14:01.539645 IP 10.0.100.100.21 > 10.0.100.100.4278: Flags [S.], seq 296173682, ack 804236181, win 0, length 0
23:14:01.539646 IP 10.0.100.100.21 > 10.0.100.100.4279: Flags [S.], seq 505740912, ack 547788184, win 0, length 0

So it does detect the land packets, but doesn’t block all of them. A better option in this case would be to enable the ip-spoofing option:

2015-08-14 21:23:48 UTC  IP spoofing! source: 10.0.100.100, destination: 10.0.100.100, protocol-id: 6, zone name: attacker, interface name: ge-0/0/2.0, action: drop

I’ll be wrapping up here for today. Part three will cover the last Screen options from the JNCIS-SEC curriculum, mostly smaller options related to OS attacks and some of the IP header fields.

Thanks for reading!

SRX Screen Options – Part 1

One of the cool features of the SRX line, inherited from the older Netscreen/ScreenOS family, are the Screen Options, which protect against some of the most common reconnaissance and attack methods. Basically, it is a low-level, simplified sort of IDS/IPS method, focusing on Layer3 and Layer4 attacks. On the plus side, it is fairly simple to set up and does not require any special licenses.

What makes Screens so desirable is that they are the first step in the Junos Flow process after Session lookup. This means they will already filter out suspect traffic before it can start consuming more resources.

SRX Screen Options in the Junos Traffic Flow

Screens are always applied on the ingress of the interface, meaning you have to keep in mind where the suspect packets will arrive on for it to be effective. Depending of the level of trust you give to different zones, different profiles will be created and applied.

Here is the topology I will be using to explore some of the most common Screen Options.

SRX Screen Options Topology

Initial configuration

The first thing to do would be to configure a Screen profile and attach it to a zone. Again, it only works ingress on the interfaces, so the screen will be applied on the attacker zone. Setup is simple.

Go to Screen stanza under the Security options and define a new Screen profile by using the set ids-option command – let’s not add any screens just yet.

[edit security screen]
root@NP-vSRX-01# set ids-option Attack-Screen description "Screen Attacker Zone"

Attach the new screen to the Security Zone. If you know where to find it you can save some CLI time by using the top command.

[edit security screen]
root@NP-vSRX-01# top set security zones security-zone attacker screen Attack-Screen

Verify the configuration with a show | compare

[edit security screen]
root@NP-vSRX-01# top show | compare
[edit security]
+   screen {
+       ids-option Attack-Screen {
+           description "Screen Attacker Zone";
+       }
+   }
[edit security zones security-zone attacker]
+    screen Attack-Screen;

Then commit the changes

[edit]
root@NP-vSRX-01# commit comment "Attack-Screen setup"
commit complete

Now that the Screen profile is attached to the attacker zone, we can try out some of the most important Screen options and the attacks they will defend against.

icmp ip-sweep – Protecting against ping sweeps

On internet-facing firewalls, a ping sweep shouldn’t pose too much of a threat as most public firewalls are (and should be!) configured to drop ICMP traffic. Not so much the case on intranet firewalls though, where ICMP is commonly permitted between “trusted” networks. In these cases, an attacker that is already on the LAN would have no issues mapping out hosts with ping sweeps alone. So, if you have an SRX that’s routing traffic between intranet segments, this one should be enabled.

We can activate the ip-sweep screen under our Screen profile by configuring icmp ip-sweep. The only adjustable parameter is the threshold.

[edit security screen ids-option Attack-Screen]
root@NP-vSRX-01# set icmp ip-sweep ?
Possible completions:
  <[Enter]>            Execute this command
  threshold            Threshold (1000..1000000 microseconds in which 10 ICMP packets are detected)
  |                    Pipe through a command

As the description points out, the threshold defines the number of microseconds it can take for 10 ICMP echo-requests to pass through the device. When ten packets are received during the threshold window, any additional packets for the remainder of the threshold will be dropped.
The default is 5000, which is 0.005 seconds. If I want it be more sensitive I will need to increase that number. For now, let’s just start with the defaults and commit.

ids-option Attack-Screen {
    description "Screen Attacker Zone";
    icmp {
        ip-sweep;
    }
}

For testing purposes, I have permitted ICMP traffic between our attacker’s zone and the dmz. Let’s see if the Screen will detect a standard nmap ping sweep from the attacker box

lab@Host200:~$ sudo nmap -sP 10.0.100.1-254

Starting Nmap 6.46 ( http://nmap.org ) at 2015-07-19 20:14 CEST
Nmap scan report for 10.0.100.1
Host is up (0.015s latency).
Nmap scan report for 10.0.100.100
Host is up (0.017s latency).
Nmap done: 254 IP addresses (2 hosts up) scanned in 33.38 seconds

It took nmap 33 seconds to sweep through a /24 range. Let’s see if that was fast enough to trigger the Screen…

root@NP-vSRX-01> show security screen statistics zone attacker | match ICMP | match sweep
  ICMP address sweep                         229

229 packets detected that were above the 10 packets per 0.005 second range.

Interesting fact: using the nmap command without sudo still gives me the same results (active hosts) but it did not trigger the Screen option. Might need to Wireshark that one day to find a difference.

Here is what is in the security logs:

2015-07-19 18:28:06 UTC  Address sweep! source: 10.0.200.200, destination: 10.0.100.239, zone name: attacker, interface name: ge-0/0/2.0, action: drop
2015-07-19 18:28:06 UTC  Address sweep! source: 10.0.200.200, destination: 10.0.100.87, zone name: attacker, interface name: ge-0/0/2.0, action: drop
2015-07-19 18:28:06 UTC  Address sweep! source: 10.0.200.200, destination: 10.0.100.180, zone name: attacker, interface name: ge-0/0/2.0, action: drop

Again, this should only be enabled if your security policy explicitly permits ICMP traffic.

tcp port-scan – limiting TCP portscans

After a host has been flagged as live on the network, the next step in recon would be to do a vertical TCP port scan against it. This is done by sending SYN-packets to the service ports. When a service is listening on a port, it will by design respond with a SYN-ACK and the port is flagged as active. The most well-known scanning tool is of course nmap.

As was the case with the ICMP sweep, a Threshold period is defined during which 10 packets can legitimately be received from one source IP. Any excess packets that are received within this window are dropped, and a logging event will be triggered.

Enabling the Screen, with a threshold value of 3 miliseconds.

[edit security screen ids-option Attack-Screen]
root@NP-vSRX-01# set tcp port-scan threshold 3000
[edit security screen ids-option Attack-Screen]
root@NP-vSRX-01# top commit

Doing a bog-standard TCP port-scan from the attacker box:

lab@Host200:~$ nmap -n 10.0.100.100

Starting Nmap 6.46 ( http://nmap.org ) at 2015-07-19 20:54 CEST
Nmap scan report for 10.0.100.100
Host is up (0.68s latency).
Not shown: 998 closed ports
PORT     STATE    SERVICE
22/tcp   open     ssh
5060/tcp filtered sip

Nmap done: 1 IP address (1 host up) scanned in 78.55 seconds

And here are the Screen statistics for the TCP port-scan:

[edit security screen ids-option Attack-Screen]
root@NP-vSRX-01# run show security screen statistics zone attacker | match "TCP port scan"
  TCP port scan                              869

Works like a champ! One thing worth mentioning is that it took nmap substantially longer to complete, 78 seconds. This is because the SRX is dropping packets when the Screen is activated. In the other case, without the Screen, the server is responding with a RST packet. For comparison, here is the result without the Screen option – 1.23 seconds.

lab@Host200:~$ nmap -n 10.0.100.100

Starting Nmap 6.46 ( http://nmap.org ) at 2015-07-19 20:57 CEST
Nmap scan report for 10.0.100.100
Host is up (0.0021s latency).
Not shown: 998 closed ports
PORT     STATE    SERVICE
22/tcp   open     ssh
5060/tcp filtered sip

Nmap done: 1 IP address (1 host up) scanned in 1.23 seconds

Syslog events:

2015-07-19 18:51:40 UTC  TCP port scan! source: 10.0.200.200:45826, destination: 10.0.100.100:135, zone name: attacker, interface name: ge-0/0/2.0, action: drop
2015-07-19 18:51:41 UTC  TCP port scan! source: 10.0.200.200:36665, destination: 10.0.100.100:25, zone name: attacker, interface name: ge-0/0/2.0, action: drop
2015-07-19 18:51:41 UTC  TCP port scan! source: 10.0.200.200:50739, destination: 10.0.100.100:1213, zone name: attacker, interface name: ge-0/0/2.0, action: drop
2015-07-19 18:51:42 UTC  TCP port scan! source: 10.0.200.200:44565, destination: 10.0.100.100:5298, zone name: attacker, interface name: ge-0/0/2.0, action: drop
2015-07-19 18:51:43 UTC  TCP port scan! source: 10.0.200.200:32828, destination: 10.0.100.100:9099, zone name: attacker, interface name: ge-0/0/2.0, action: drop

IP options – record-route, timestamp, security, stream and source-routing

These ones cover a couple of derelict options in the IP header that were originally introduced in RFC791..

Here’s a quick rundown of the proposed IP options, straight from the RFC.

  • Option 2 – Security – Used to carry Security, Compartmentation, User Group (TCC), and Handling Restriction Codes compatible with DOD requirements.
  • Option 3 – Loose Source Routing – Used to route the internet datagram based on information supplied by the source.
  • Option 9 – Strict Source Routing – Used to route the internet datagram based on information supplied by the source
  • Option 7 – Record Route – Used to trace the route an internet datagram takes.
  • Option 4 – Timestamp – Internet Timestamp
  • Option 8 – Stream ID – used to carry the stream identifier

Because these options are no longer used in current-day traffic, it is best to have them filtered or at least detected by the Screens. If a packet with any of these options is detected, a syslog event will be recorded.

Some clarification about the three different source-route Screens:

  • loose-source-route-option: logs when packets with option 3 are detected
  • strict-source-route-option: logs when packets with option 9 are detected
  • source-route-option: discards all packets where source-route options are detected

Depending on your own preference, you can choose to detect soure-route options or block them altogether. I don’t see any reason to let this pass, so I will configure the source-route-option.

Because it’s slightly related, I will also enable the bad-options screen. This will drop any packet that has malformed IP options in the header field.

Here is how all of the IP options Screens are enabled:

[edit security screen ids-option Attack-Screen]
root@NP-vSRX-01# set ip security-option record-route-option timestamp-option stream-option source-route-option bad-option
root@NP-vSRX-01# show | compare
[edit security screen ids-option Attack-Screen]
+  ip {
+      bad-option;
+      record-route-option;
+      timestamp-option;
+      security-option;
+      stream-option;
+      source-route-option;
+  }

tcp syn-fin, fin-no-ack and tcp-no-flag – Operating System detection

By setting an illegal TCP flag and analysing the way the host responds, an attacker might be able to identify the remote Operating System and move on to trying OS-specific exploits. By enabling these Screen options, the SRX will detect and block these specific packets. The configuration is straightforward – all you need to do is enable them.

[edit security screen ids-option Attack-Screen]
root@NP-vSRX-01# set tcp tcp-no-flag syn-fin fin-no-ack

[edit security screen ids-option Attack-Screen]
root@NP-vSRX-01# commit
commit complete

Let’s see if nmap is using any of these options to recognise the OS.

lab@Host200:~$ sudo nmap -O 10.0.100.100

Starting Nmap 6.46 ( http://nmap.org ) at 2015-07-19 22:46 CEST
Nmap scan report for 10.0.100.100
Host is up (0.0032s latency).
Not shown: 998 closed ports
PORT     STATE    SERVICE
22/tcp   open     ssh
5060/tcp filtered sip
No exact OS matches for host (If you know what OS is running on it, see http://nmap.org/submit/ ).
TCP/IP fingerprint:
OS:SCAN(V=6.46%E=4%D=7/19%OT=22%CT=1%CU=43081%PV=Y%DS=2%DC=I%G=Y%TM=55AC0D0
OS:9%P=x86_64-pc-linux-gnu)SEQ(SP=104%GCD=1%ISR=10E%TI=Z%TS=8)OPS(O1=M5B4ST
OS:11NW7%O2=M5B4ST11NW7%O3=M5B4NNT11NW7%O4=M5B4ST11NW7%O5=M5B4ST11NW7%O6=M5
OS:B4ST11)WIN(W1=7120%W2=7120%W3=7120%W4=7120%W5=7120%W6=7120)ECN(R=Y%DF=Y%
OS:T=40%W=7210%O=M5B4NNSNW7%CC=Y%Q=)T1(R=Y%DF=Y%T=40%S=O%A=S+%F=AS%RD=0%Q=)
OS:T2(R=N)T3(R=N)T4(R=N)T5(R=Y%DF=Y%T=40%W=0%S=Z%A=S+%F=AR%O=%RD=0%Q=)T6(R=
OS:N)T7(R=N)U1(R=Y%DF=N%T=40%IPL=164%UN=0%RIPL=G%RID=G%RIPCK=G%RUCK=G%RUD=G
OS:)IE(R=Y%DFI=N%T=40%CD=S)

Network Distance: 2 hops

OS detection performed. Please report any incorrect results at http://nmap.org/submit/ .
Nmap done: 1 IP address (1 host up) scanned in 113.28 seconds

The results are quite impressive. Effectively, nmap has failed to detect the underlying Operating System. In the Screen statistics, we can see that quite a number of alarms were triggered:

root@NP-vSRX-01# run show security screen statistics zone attacker
Screen statistics:

IDS attack type                              Statistics
  ICMP flood                                 0
  UDP flood                                  0
  TCP winnuke                                0
  TCP port scan                              47
  UDP port scan                              0
  ICMP address sweep                         0
  TCP sweep                                  0
  UDP sweep                                  0
  IP tear drop                               0
  TCP SYN flood                              0
  IP spoofing                                0
  ICMP ping of death                         0
  IP source route option                     0
  TCP land attack                            0
  TCP SYN fragment                           0
  TCP no flag                                20
  IP unknown protocol                        0
  IP bad options                             0
  IP record route option                     0
  IP timestamp option                        0
  IP security option                         0
  IP loose source route option               0
  IP strict source route option              0
  IP stream option                           0
  ICMP fragment                              0
  ICMP large packet                          0
  TCP SYN FIN                                20
  TCP FIN no ACK                             20
  Source session limit                       0
  TCP SYN-ACK-ACK proxy                      0
  IP block fragment                          0
  Destination session limit                  0
  IPv6 extension header                      0
  IPv6 extension hop by hop option           0
  IPv6 extension destination option          0
  IPv6 extension header limit                0
  IPv6 malformed header                      0
  ICMPv6 malformed packet                    0

It seems that Nmap is in fact using the No-Flag, SYN-FIN and FIN-no-ACK flags to identify the OS, and has tried each method 20 times. Interestingly, it sent the probes to the only open port, 22.
In the Security log, the following messages were recorded multiple times:

2015-07-19 20:44:32 UTC  No TCP flag! source: 10.0.200.200:45357, destination: 10.0.100.100:22, zone name: attacker, interface name: ge-0/0/2.0, action: drop
2015-07-19 20:44:32 UTC  SYN and FIN bits! source: 10.0.200.200:45358, destination: 10.0.100.100:22, zone name: attacker, interface name: ge-0/0/2.0, action: drop
2015-07-19 20:44:32 UTC  FIN but no ACK bit! source: 10.0.200.200:45362, destination: 10.0.100.100:1, zone name: attacker, interface name: ge-0/0/2.0, action: drop

Because this is turning into quite a lengthy post, I will wrap up here and continue with the other Screens in an upcoming post.

Thanks for reading, and feel free to add your commments or remarks below!

Setting up a virtual lab topology with Juniper vSRX

Up until now, I’ve been doing most of my studies on real hardware. This was okay with Cisco gear, but Juniper hardware isn’t as cheap on the second hand market. Second, I always loose vast amounts of time reconfiguring appliances on the console, cabling them up, reconfiguring switchports and installing physical or virtual test machines. I recently installed an ESXi whitebox, with loads of RAM and compute power idle, so why not start virtualizing my labs?

The Juniper vSRX Integrated Virtual Firewall, formerly known as Firefly Perimeter, is a virtual appliance that brings all the features of the SRX firewalls to your virtual layer. Even better, you can use the full-featured trial version of the appliance for 60 days. Perfect for labbing purposes!

In this post, I will go through the steps of setting up the virtual appliance and giving it a basic configuration. Below is the topology I will be implementing and using for some parts of my JNCIS-SEC studies. I haven’t found an “official” installation guide from Juniper -although I haven’t really looked either- but the below scenario works for me.

Downloading and importing the virtual machine

You can download a 60-day trial version of the vSRX on the Juniper site, although you will need to register for a Juniper account. Get it here!
I am using VMware ESXi 6.0 so in my case I chose the OVA template: junos-vsrx-12.1X47-D20.7-domestic.ova.

Once the file has been downloaded, start your vSphere Client and choose File > Deploy OVF Template

vSRX - Deploying the OVF Template

On the next window, enter the path for the OVA file you downloaded from the Juniper site earlier and click Next

vSRX - Enter the file path

On the next screen, the vSphere client will give you an overview of the template properties.

vSRX - OVF Template Details

Click next and Accept the license agreement. On the next screen you can define a name for the Virtual Machine. I’m giving it the hostname of NP-vSRX-01

vSRX - OVF Name

When vSphere asks you about the Disk Provisioning, choose Thick Provisioned – the default.

vSRX - Disk Settings

Leave the Network mappings at the defaults. We will manually assign the interfaces in the VM settings later.

vSRX - Network Mappings

When you arrive at the last page, the wizard will give you an overview of the settings you just entered. Don’t power on the device just yet, as we still need to add some interfaces.

vSRX - Virtual Machine Summary

When you click Finish, vSphere will upload the image, set up the virtual machine and apply the settings.

vSRX - Deploying the appliance

Integrating vSRX into the topology

Before I start configuring the interfaces, let’s have a look at my lab topology.

vSRX - Network Topology

  • The outside interface, in the untrust zone, will have an IP of 1.1.1.1/28. The next-hop for the default route will be 1.1.1.14, which is actually my hardware SRX. This network is tagged as VLAN255 towards my switches. I will use the 12 spare addresses for NAT labbing later on.
  • On the inside, there are two networks with virtual machines, VLAN100 and VLAN200. These will both be in their own zone, dmz-100 and dmz-200.

To get this topology up and running, I will need three interfaces on the SRX. Here are my interface mappings:

Network Adapter 1 – ge0/0/0 – vlan255 (untrust)
Network Adapter 2 – ge0/0/1 – vlan100 (dmz-100)
Network Adapter 3 – ge0/0/2 – vlan200 (dmz-200)

By default, the VM is provisioned with two interfaces. This would be your ge0/0/0 and ge0/0/1 interfaces. Let’s add a third one, which will be ge0/0/2. To do so, select the virtual machine, right-click and choose Edit settings. On the Settings window, click the Add button.

vSRX - Edit Machine Settings

vSRX - Add Interface

Choose Ethernet Adapter and click Next. On the next page, leave E1000 as the interface type. We can immediately map it to the correct VLAN (200) here.

vSRX - Add E1000 inteface

Click Next and Finish on the summary page. There are now three ethernet interfaces on the Machine Settings window.
Network Adapter 1 should be in VLAN255. This can be configured on the Network Label dropdown menu.

vSRX - Configure Network Adapter 1

Repeat for Network Adapter 2, which should be in VLAN100.

vSRX - Configure Network Adapter 2

Finally, after lots of clicking around, our machine is ready to go. Let’s power it up and open the Console to add the basic settings.

When the device has booted, you will be presented with the username prompt. As is the case with the hardware SRXs, you should enter root as the username, without a password.

vSRX - vSRX Console prompt

When you first log on as root, you are put in the BSD environment. Enter cli to get to the Junos command prompt.
In the operational command prompt, let’s verify that we have our ge0/0/0, ge0/0/1 and ge0/0/2 interfaces by entering the show interfaces terse command.

vSRX - Show interfaces terse

Excellent, our interfaces are there but as you can see they are preconfigured with standard IP addresses in the RFC1918 192.168.0.0/16 ranges. Let’s get rid of these factory-defaults and start with a clean slate. To do this, enter configuration mode and wipe all configuration by entering delete in the root context.

Wiping the default config

You will not be able to save the configuration without entering a root authentication password. That syntax is in the screenshot.

To get the outside connectivity, I added the interface and routing configuration below. Since this is a lab, and I’m connecting from the outside I’m allowing ping and SSH on the untrust zone

system {
    root-authentication {
        encrypted-password "$1$st4hY7Hd$jYp76UJZvKaQV09jcj72P1"; ## SECRET-DATA
    }
    services {
        ssh;
    }
}
interfaces {
    ge-0/0/0 {
        unit 0 {
            family inet {
                address 1.1.1.1/28;
            }
        }
    }
}
routing-options {
    static {
        route 0.0.0.0/0 next-hop 1.1.1.14;
    }
}
security {
    zones {
        security-zone untrust {
            host-inbound-traffic {
                system-services {
                    ssh;
                    ping;
                }
            }
            interfaces {
                ge-0/0/0.0;
            }
        }
    }
}

Once this config is active, I can SSH directly into the virtual device instead of configuring it on the console. Now, let’s configure the addressses for VLAN100 and VLAN200.

[edit interfaces]
root# show
ge-0/0/1 {
    unit 0 {
        family inet {
            address 10.0.100.1/24 {
                preferred;
            }
        }
    }
}
ge-0/0/2 {
    unit 0 {
        family inet {
            address 10.0.200.1/24 {
                preferred;
            }
        }
    }
}

Next up, configuring the security zones, dmz-100 and dmz-200

[edit security zones]
root# show
security-zone dmz-100 {
    host-inbound-traffic {
        system-services {
            ping;
        }
    }
    interfaces {
        ge-0/0/1.0;
    }
}
security-zone dmz-200 {
    host-inbound-traffic {
        system-services {
            ping;
        }
    }
    interfaces {
        ge-0/0/2.0;
    }
}

For testing purposes, I’m allowing ping inbound on the dmz interfaces. After committing, let’s try reaching the default gateway on the server in VLAN100.

Verifying connectivity

Great, it works! Now I have a fully functional, virtual topology for my JNCIS-SEC studies. No more messing around with cables! 🙂